RKLB 48-day bearish forecast — Nov 1, 2026
- Bias: Bearish
- Timeframe: 48 days (made Nov 1, 2026, target date Dec 18, 2026)
- Price at analysis: $54.73
- Price target: $50.00
- Expected range: $44.00 – $62.00
- Result: Pending — graded after the close on Dec 18, 2026
Get a free AI analysis of RKLB today
Analysis
TECHNICAL INDICATORS
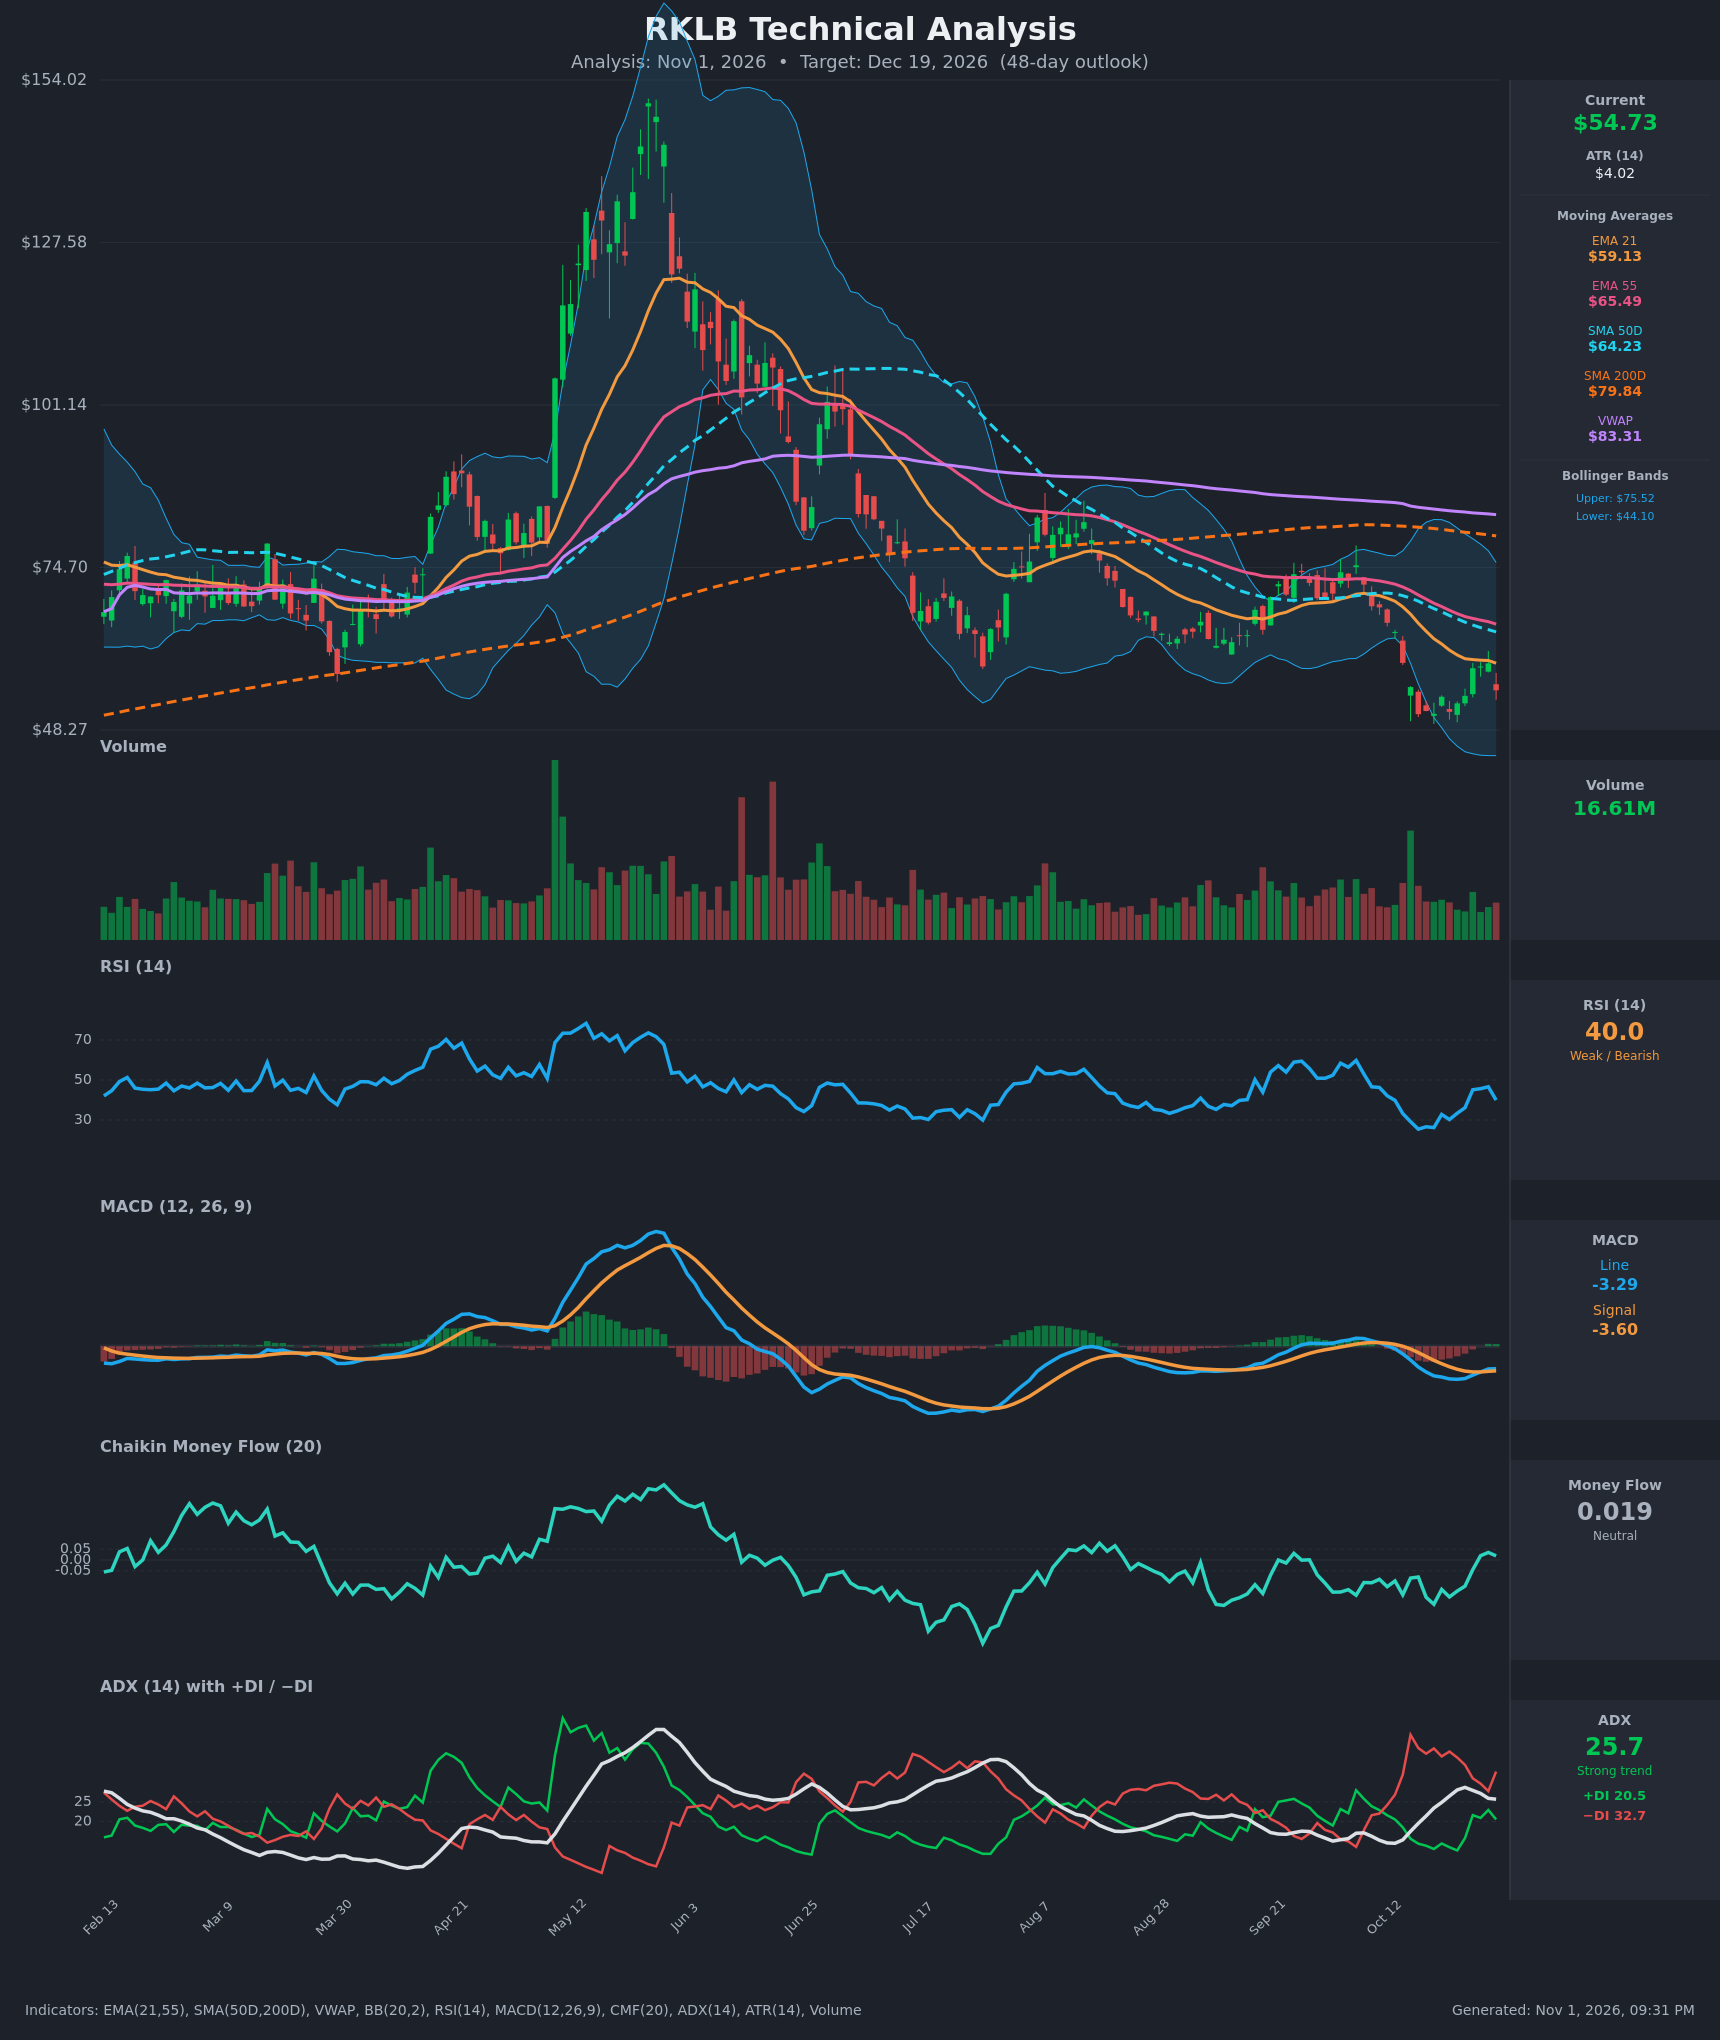
- RSI (14): 39.96, which sits below 50 and is rolling over after a bounce from deeply oversold (25.4 on Oct 16). It peaked at 46.6 on Oct 29 and fell back sharply with the -7.5% drop on Oct 30. The lower high shows weak momentum. [Bearish]
- 20 EMA (EMA 21): $59.13. Price at $54.73 is below it, and the EMA is still sloping down (EMA21 $59.13 < EMA55 $65.49). The rally to $59.10 stalled right at the EMA21, so it acted as resistance. [Bearish]
- MACD: Line -3.29, signal -3.60, so the line is just above the signal (histogram about +0.31). It made a tentative bullish crossover on Oct 28, but both lines remain deeply negative and the line has stalled near -3.3. The crossover is weak and may be about to fail after the Oct 30 drop. [Neutral]
- Bollinger Bands (20): Upper $75.52, lower $44.10, midline about $59.8. Price is in the lower half of the bands, well off the lower band, after touching it during the mid-October flush. The bands are still wide, which reflects high volatility. Price was rejected at the midline, which is a bearish sign. [Bearish]
- CMF (20): 0.019, between -0.05 and +0.05. It has recovered from -0.205 to marginally positive, so selling pressure has eased, but it is not yet accumulation. [Neutral]
- ADX (14): 25.7 with -DI 32.7 above +DI 20.5. ADX is above 25 and has risen from 14.5 to a peak of 28.7. The trend is strong, and the bears control it. [Strong Trend – Bearish]
- Volume: 16.61M on the latest down candle, roughly average. The mid-October capitulation drew a heavy volume spike, and the bounce came on lighter volume. There is no clear sign of buyer conviction. [Neutral to Bearish]
DIVERGENCES & TRENDS
- Moving averages: Price is below the EMA21 ($59.13), EMA55 ($65.49), SMA50D ($64.23), SMA200D ($79.84) and VWAP ($83.31). The stack is fully bearish. The SMA50D is below the SMA200D (death cross in place) and the EMA21 is below the EMA55.
- Price vs. MACD/RSI: The Oct 16 low ($50.84) had RSI at 25.4. The Oct 20 retest ($50.90) had RSI at 26.2, so there is a tiny base but no meaningful bullish divergence. The MACD histogram turned positive but remains below zero overall.
- Failed bounce: The Oct 27–29 rally ($58–59) stalled at the EMA21, then price dropped to $54.73 on Oct 30. This is a lower high relative to the earlier downtrend.
- DI: -DI has stayed above +DI since Oct 12. The gap narrowed to 20.9 vs 29.7 but widened again on Oct 30 (+DI 20.5, -DI 32.7).
- Longer-term: The stock is down from about $150 in late May to $55, a drawdown of roughly 63%, with lower highs and lower lows since then.
CHART PATTERNS
- Bearish Rising Wedge / Bearish Flag (continuation): The Oct 16 to Oct 29 bounce looks like a corrective rising channel inside the larger downtrend. The sharp Oct 30 rejection at the EMA21 hints at a bearish flag breakdown, with a measured move toward the mid-$40s (roughly the lower Bollinger Band at $44.10).
- Potential Bullish Double Bottom (low confidence): Lows at about $50.84 (Oct 16) and $50.90 (Oct 20) form a possible double bottom with the neckline near $59, which is also the EMA21. Price has not broken the neckline, so the pattern is unconfirmed. A close above $59–60 would put the target near $68 (neckline plus pattern height of about $8), but this is the less likely path.
- Range: The structure is a base at $50–51 and resistance at $59–60. Price is in the middle of it and tilting toward the lower end.
POTENTIAL SCENARIOS
- Scenario 1: Bearish Breakdown Below the $50–51 Double-Bottom Support — The Oct 29 rejection at the EMA21 and the -DI dominance (ADX above 25) favor a retest and break of the $50.85 lows. Trigger: daily close below $50.80. Target: $44–46 (lower Bollinger Band at $44.10). Invalidation: daily close above $60. (50% probability)
- Scenario 2: Neutral Range Chop Between $50 and $59 — Price holds the double-bottom floor but cannot clear the EMA21, so it ranges. Trigger: holding $50.80 while failing at $59–60. Target: $52–57. Invalidation: close outside $50–60. (25% probability)
- Scenario 3: Bullish Double-Bottom Breakout — CMF turns positive and MACD holds its crossover. Price breaks the neckline and EMA21. Trigger: daily close above $60 on rising volume. Target: $65–68 (EMA55 and SMA50D). Invalidation: close back below $54. (25% probability)
PRICE TARGETS
For the 48-day timeframe, the range width should be about 12–18% of the current price, with the 48-day horizon at the upper end because of high volatility (ATR $4.02, about 7.4% of price). Expected Range: $46.00 to $62.50, a width of $16.50 (about 30%). That is wider than the guideline, but the stock is high-beta, and I am keeping the range wide enough to cover both the breakdown and the neckline-reclaim paths. Self-check: $16.50 / $54.73 = 30.1%. This is above the guideline band, but it is justified by ATR (about 7.4% per day, in a stock that moved 15% in 3 days).
- Target Price: $50.00 (48-day horizon, below the current price in line with the bearish bias)
- Expected Range: $44.00 to $62.00
- Key Levels: Support at $50.80, Resistance at $59.10
OVERALL BIAS
OVERALL BIAS: BEARISH - Price is below every major moving average (EMA21, EMA55, SMA50D, SMA200D, VWAP) with -DI above +DI and ADX above 25. The bounce failed at the EMA21 and RSI is rolling over below 40, so a retest of the $50–51 lows and a move toward the lower Bollinger Band looks more likely than a reclaim of $60.
This is educational analysis and not financial advice.