PLTR 48-day bearish forecast — Nov 1, 2026
- Bias: Bearish
- Timeframe: 48 days (made Nov 1, 2026, target date Dec 18, 2026)
- Price at analysis: $184.11
- Price target: $174.00
- Expected range: $159.00 – $189.00
- Result: Pending — graded after the close on Dec 18, 2026
Get a free AI analysis of PLTR today
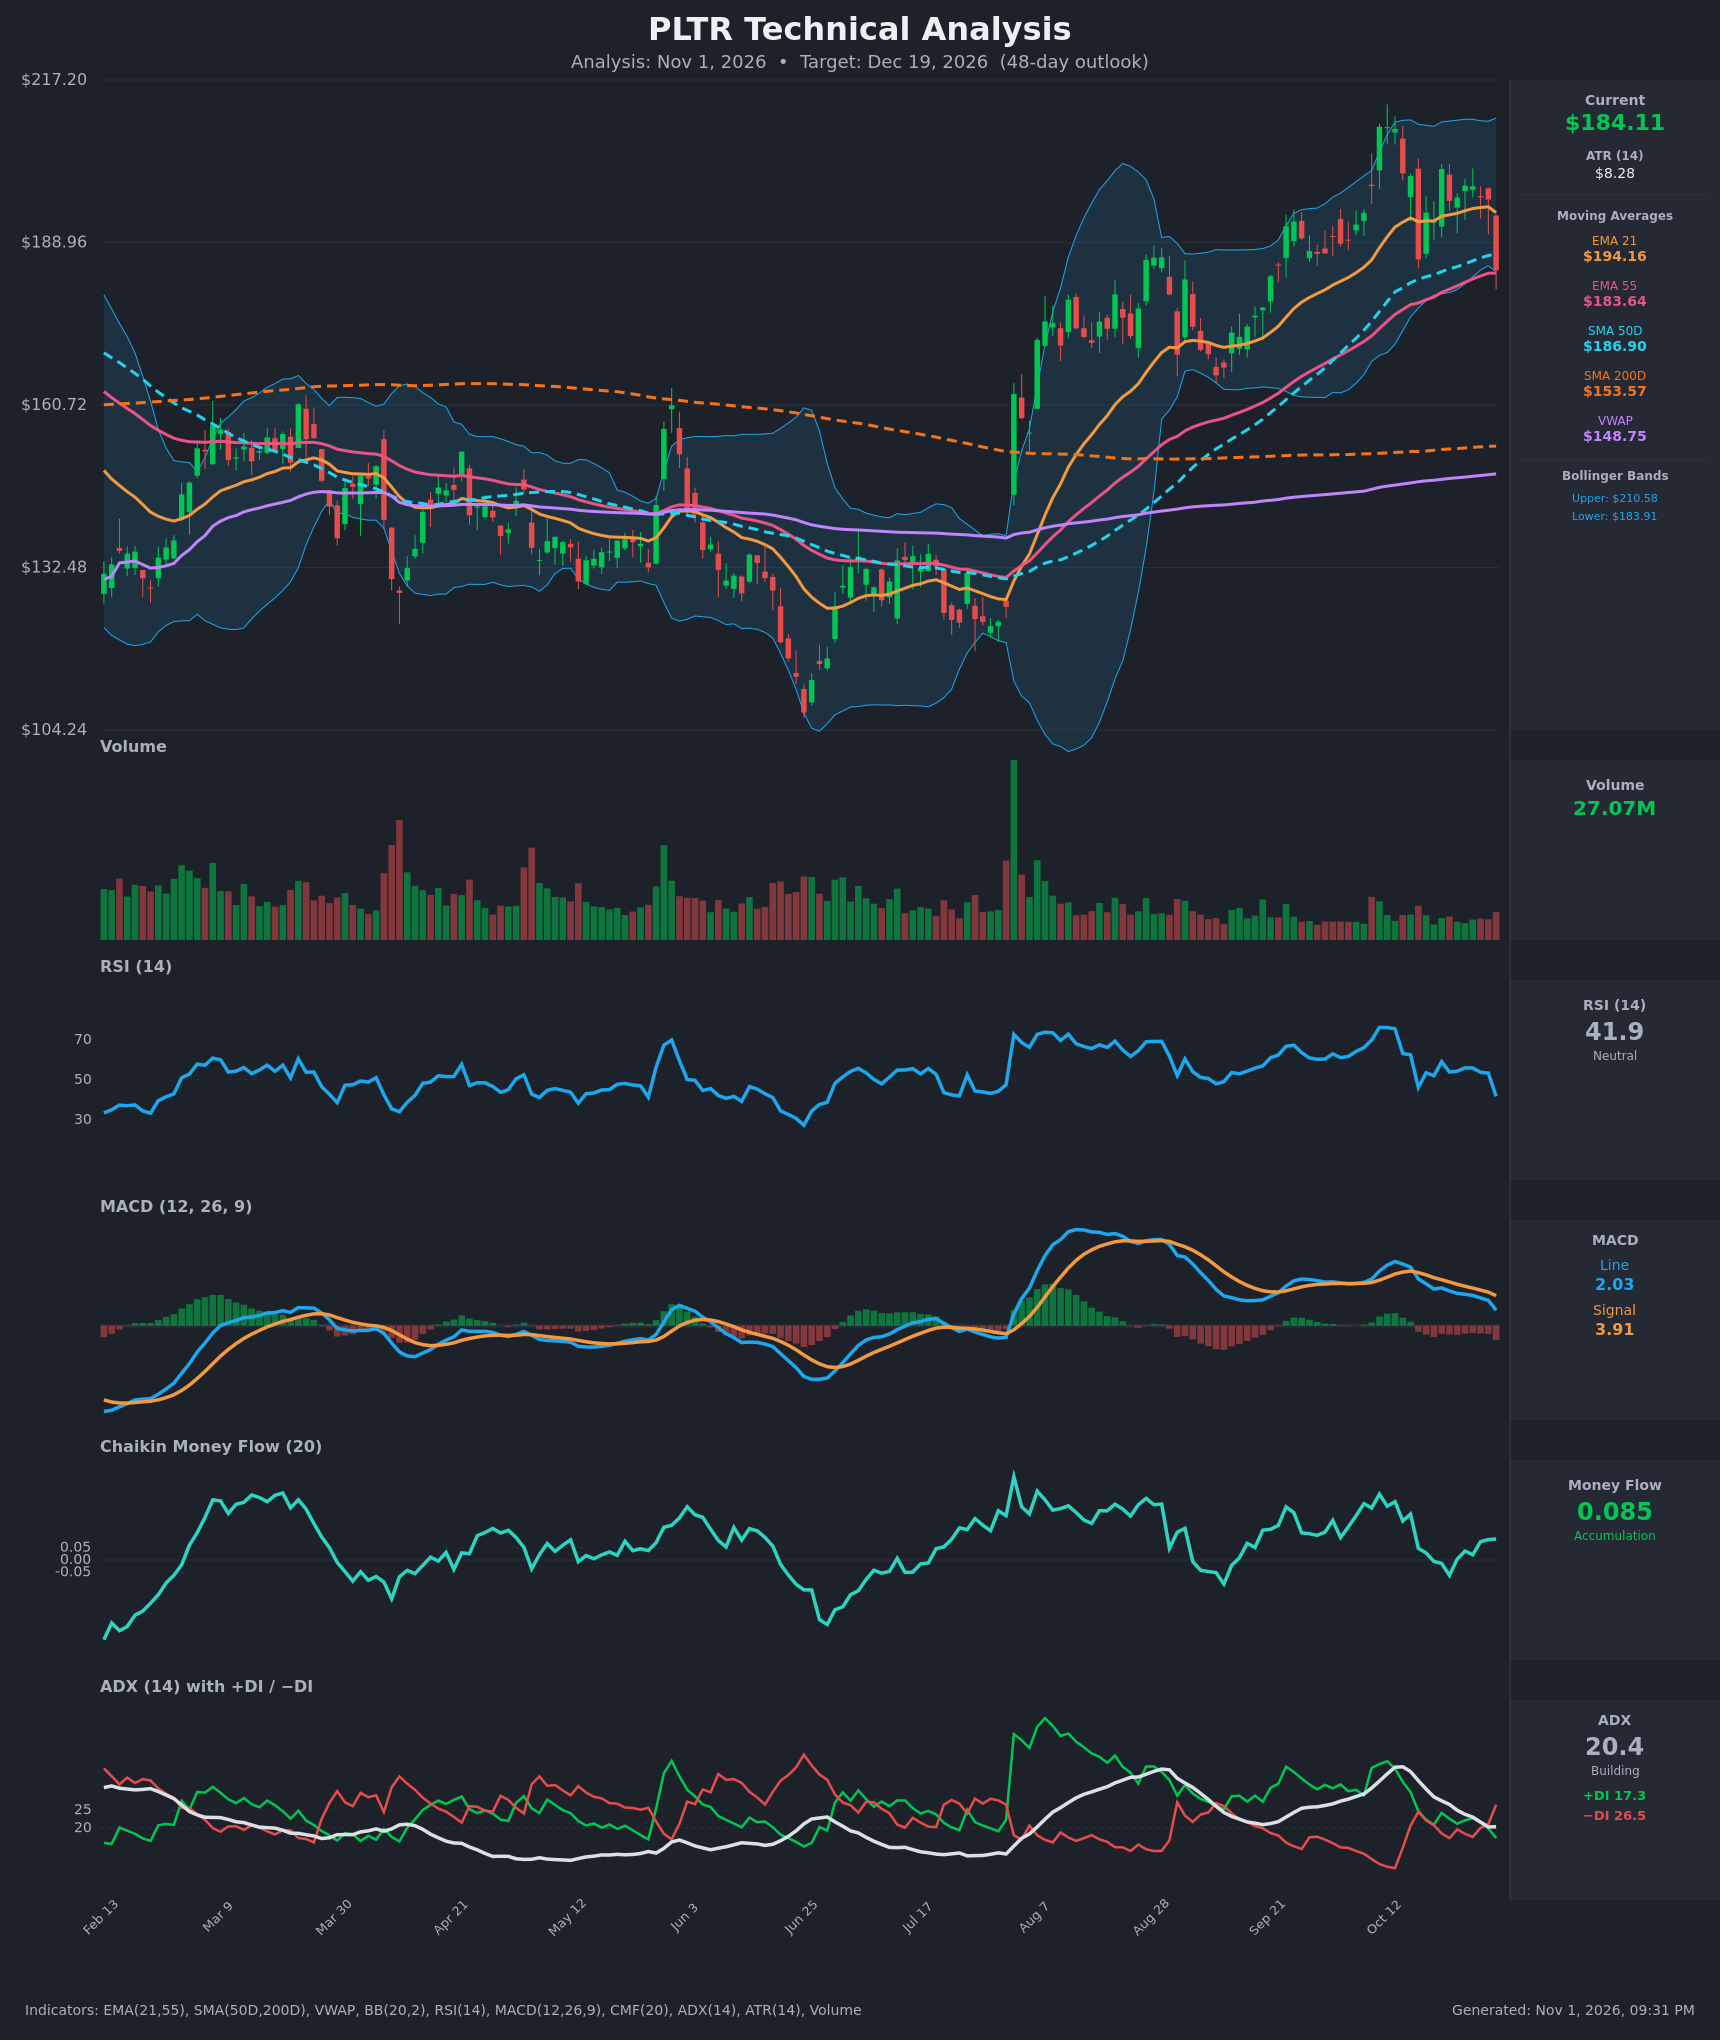
Analysis
TECHNICAL INDICATORS
- RSI (14): 41.86, down sharply from 53.4 the prior day and from 76 on Oct 12. It is below 50 and falling, but not yet oversold, so there is room to fall further. [Bearish]
- 20 EMA: The 21 EMA is $194.16 and price ($184.11) closed about 5% below it after being above or around it for weeks. The EMA now acts as overhead resistance and is starting to roll over (195.16 → 194.16). [Bearish]
- MACD: The line (2.03) is below the signal (3.91), a bearish crossover that happened around Oct 16. The histogram is negative and widening (-1.88 vs -1.08 the day before). The line is fading toward zero from a peak of 8.4, so momentum is deteriorating. [Bearish]
- Bollinger Bands (20): Upper is $210.58 and lower is $183.91. Price closed at $184.11, right on the lower band, after a -6.3% day. The bands are fairly wide (about 14% of price). A close on the lower band can mean a short-term bounce, but in a fresh breakdown it often leads to a band walk. [Neutral/Bearish]
- CMF (20): 0.085, above the +0.05 threshold, so money flow is still mildly positive. It has been fading from 0.237 and was negative for several days (Oct 20-22), so accumulation is weak and not confirming. [Accumulation]
- ADX (14): 20.4, down from 37, so the old uptrend is exhausted and the market sits at the weak-trend threshold. -DI (26.5) just crossed above +DI (17.3), so bears have taken control. A rising ADX from here would confirm a new downtrend. [Weak Trend, bearish DI tilt]
- Volume: 27.07M on the red candle, higher than the muted volume of recent weeks. The selloff came on heavier participation than the grind-up days, which suggests real distribution. [Bearish]
DIVERGENCES & TRENDS
- Momentum divergence: Price made a marginal high near $209 on Oct 12-13, while MACD (8.4) and ADX (37) peaked and then weakened. Subsequent rallies ($201.72, $198.84) were lower highs on weaker MACD readings, which is a bearish divergence/rollover.
- Moving average structure: Price ($184.11) is below the 21 EMA ($194.16) and the 50 SMA ($186.90), and sits just above the 55 EMA ($183.64). The 21 EMA is still above the 55 EMA, so there is no bearish EMA cross yet, but the gap is narrowing (about $10.5 versus $14.7 on Oct 12).
- Long-term trend: Price is above the 200 SMA ($153.57), and the 50 SMA is above the 200 SMA (golden cross in place). The long-term uptrend is intact, which limits how far a correction should go.
- Key crossovers: Bearish MACD cross (confirmed), -DI over +DI (new), price below the 21 EMA and 50 SMA (new). CMF positive is the lone dissenting signal.
- VWAP: At $148.75, VWAP is far below price, which reflects the big rally off the July lows and leaves a long way to fall before it matters.
CHART PATTERNS
- Bearish Double Top (reversal): Peaks at about $209 on Oct 12-13 with a neckline near $186 (the Oct 16 low of $186.03). The latest close at $184.11 is below that neckline, a confirmed breakdown. The measured move is about $23 (peak minus neckline), giving a target near $163.
- Lower-high sequence: Rallies to $201.7 and $198.8 failed below the prior peak, confirming the shift to a distribution structure.
- Caveat: The September consolidation zone ($170-$185) and the rising 55 EMA/50 SMA cluster should provide support, so a full measured move to $163 is less likely than a partial one. A reclaim of $194-$196 would negate the pattern and revert to the rising-channel/flag interpretation.
POTENTIAL SCENARIOS
- Scenario 1: Bearish Double Top Breakdown/Correction — Price loses the 55 EMA ($183.64) and the neckline, then drifts toward the September consolidation base. The 55 EMA and 50 SMA flip to resistance. Trigger: daily close below $183.00 with ADX rising above 25 and -DI staying on top. Target: $170-$175 first, extending to $160-$163 (double-top measured move). Invalidation: daily close above $194.20 (the 21 EMA). (50% probability)
- Scenario 2: Bullish Dip-Buy Rebound — The lower Bollinger Band, 55 EMA and 50 SMA cluster attracts buyers, with CMF still positive and the long-term trend intact. Trigger: reclaim of $187 (the 50 SMA) followed by a close above $194. Target: $198-$205, then a retest of the $209-$210 highs. Invalidation: close below $178. (30% probability)
- Scenario 3: Neutral Range Consolidation — The market chops between $172 and $194 as ADX stays near 20 and the moving averages converge. Trigger: failure to break either side after the next few sessions. Target: $180-$188. Invalidation: decisive close outside the $172-$194 range. (20% probability)
PRICE TARGETS
- Target Price: $174.00 (48-day, Dec 19, 2026)
- Expected Range: $159.00 to $189.00 (width $30 = about 16.3% of price, in line with the 12-18% guidance for 30-60 days; about 3.6x ATR)
- Key Levels: Support at $175.00 (September consolidation base; 55 EMA $183.64 is immediate support, and the 200 SMA at $153.57 is the major floor). Resistance at $186.90 (50 SMA), with further resistance at $194.16 (21 EMA) and $210.58 (upper BB).
OVERALL BIAS
OVERALL BIAS: BEARISH - A confirmed double-top neckline break on heavy volume, a bearish MACD cross, -DI taking over from +DI, and price below the 21 EMA and 50 SMA point to a corrective leg. The intact 200 SMA uptrend and positive CMF should limit the decline to roughly $165-$175 rather than a full reversal.
This is educational analysis and not financial advice.