SOFI 48-day bullish forecast — Nov 1, 2026
- Bias: Bullish
- Timeframe: 48 days (made Nov 1, 2026, target date Dec 18, 2026)
- Price at analysis: $16.76
- Price target: $17.60
- Expected range: $14.90 – $19.40
- Result: Pending — graded after the close on Dec 18, 2026
Get a free AI analysis of SOFI today
Analysis
TECHNICAL INDICATORS
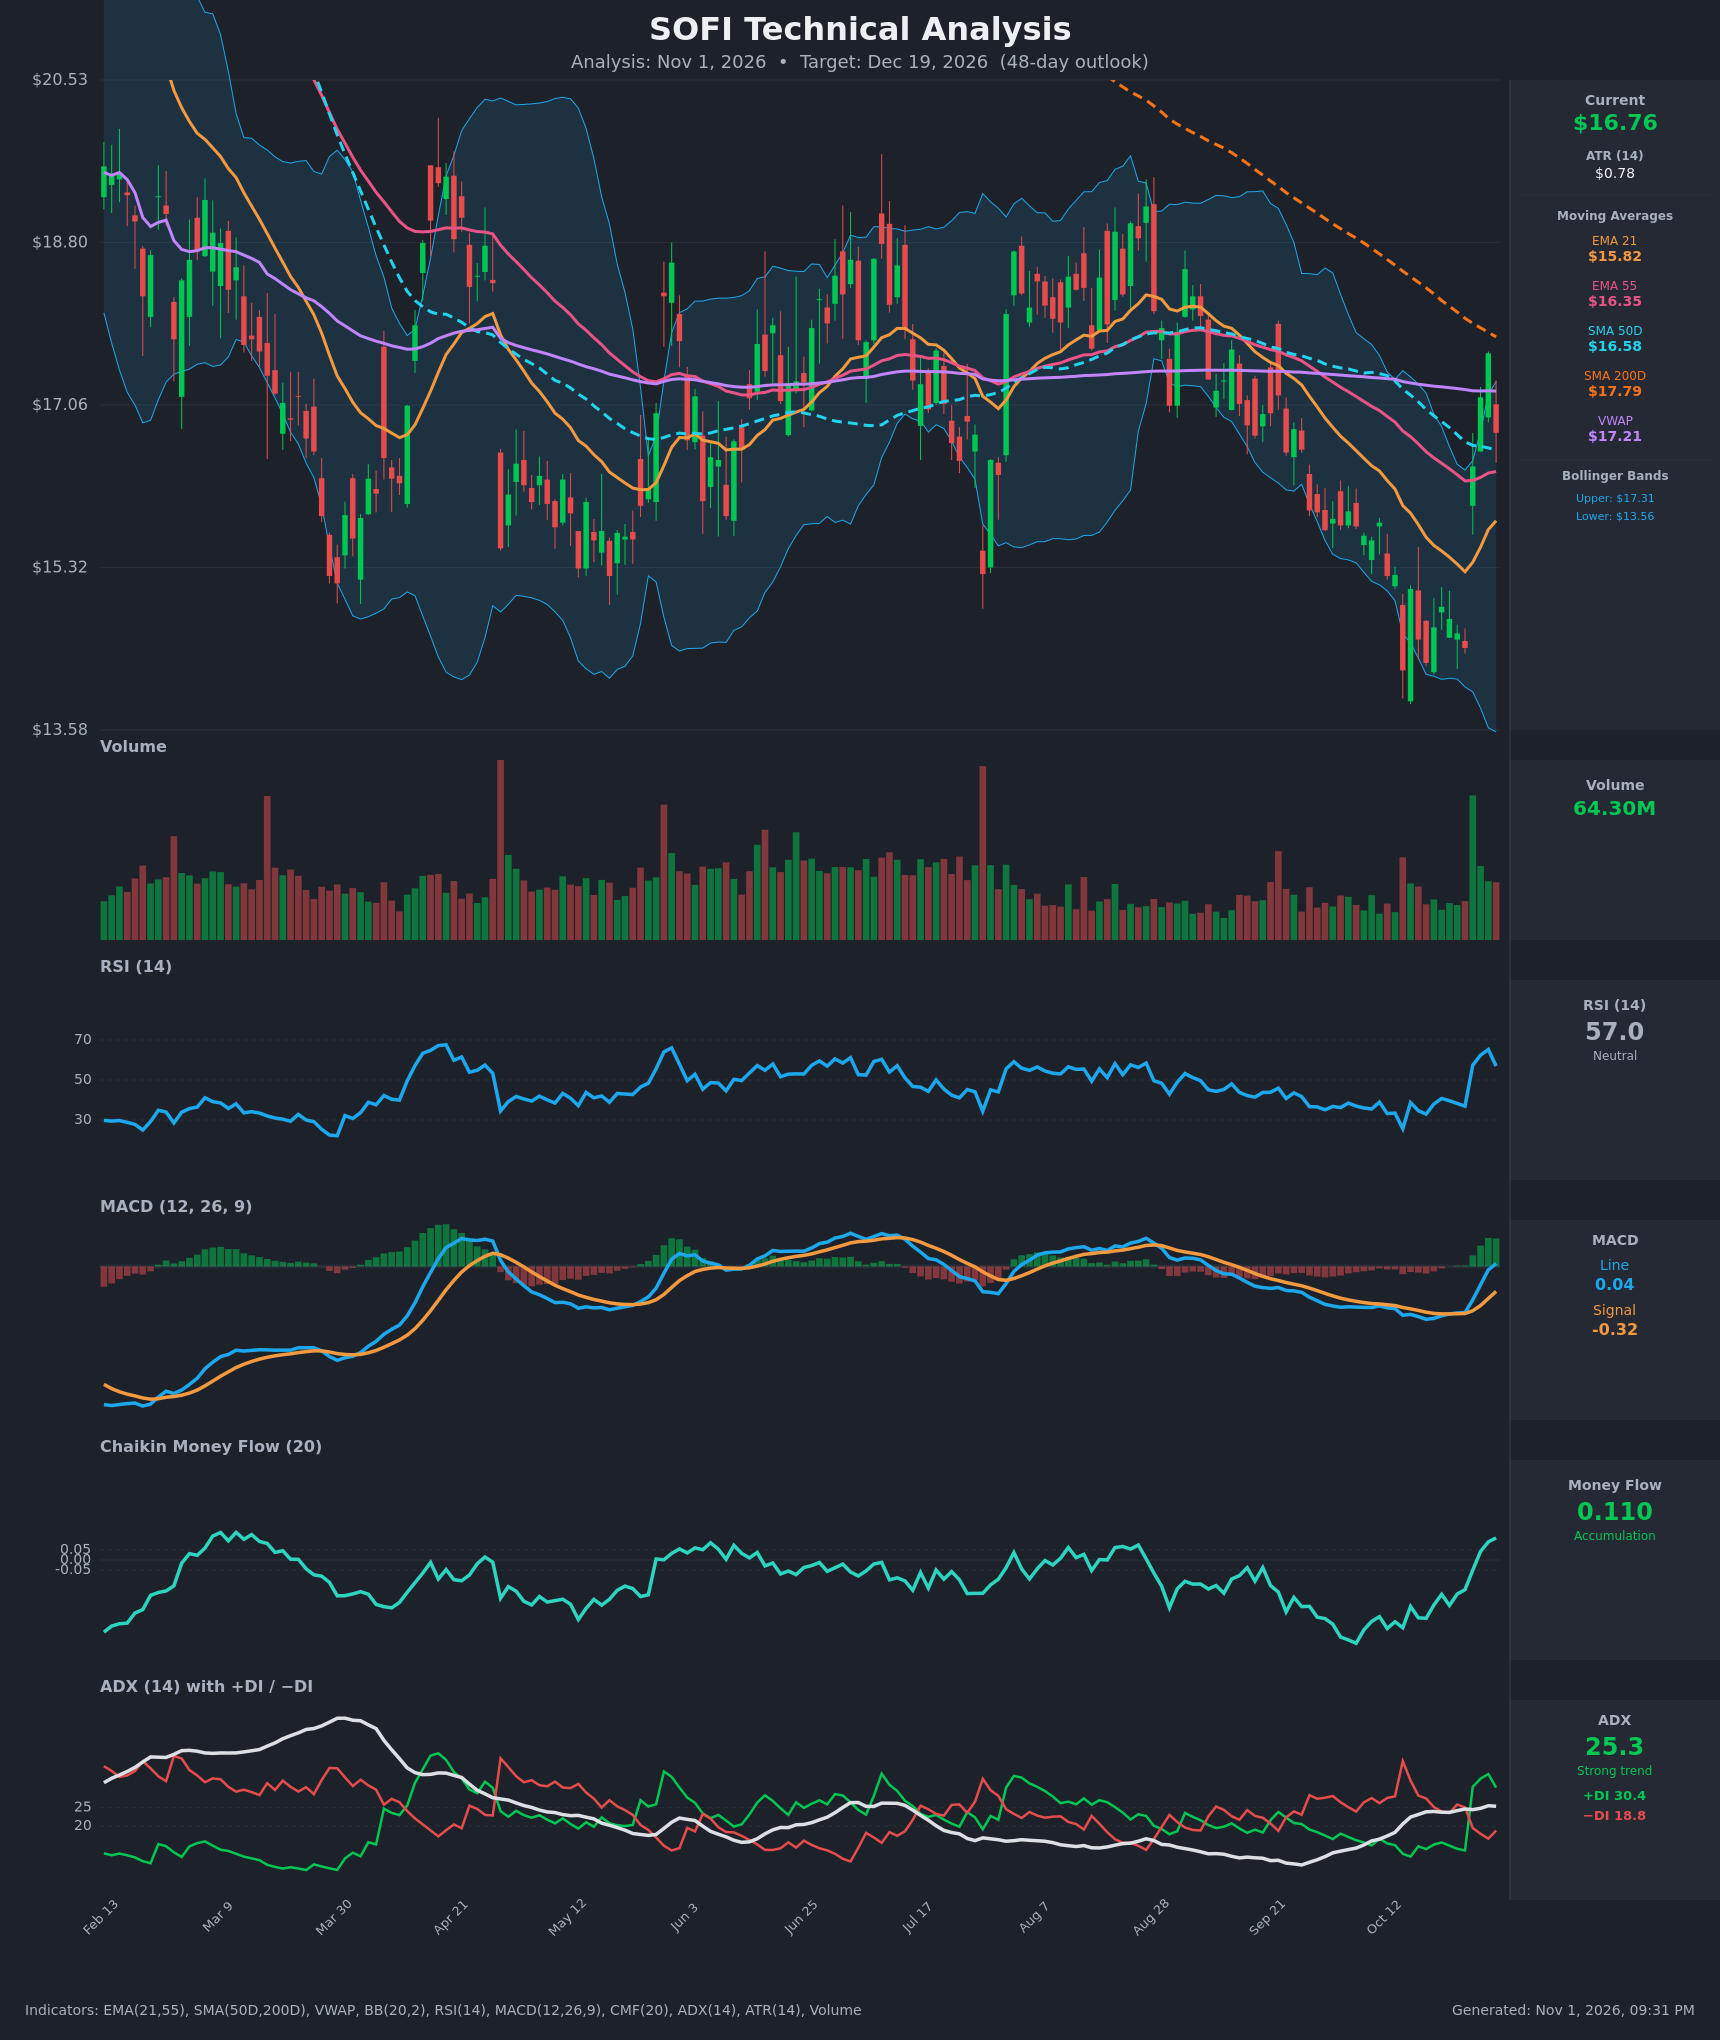
- RSI (14): 56.97, down from a 65.2 peak on Oct 29 after surging from the 25.7 oversold low on Oct 14. It sits just above the 50 midline, so momentum is constructive but cooling after the sharp bounce. [Bullish]
- 20 EMA (EMA 21): $15.82, with price at $16.76 about 6% above it. The EMA is rising after bottoming near $15.27, so it acts as dynamic support. EMA21 is still below EMA55 ($16.35), so there is no bullish EMA crossover yet, but the gap is closing quickly. [Bullish]
- MACD: Line +0.038 crossed above the Signal at -0.322 on Oct 27-30, and the histogram has flipped positive and is expanding. The line has just crossed the zero line. This is a fresh bullish crossover from deeply negative territory. [Bullish]
- Bollinger Bands (20): Upper $17.31, lower $13.56, so the bands are wide (about $3.75). Price at $16.76 is in the upper half, roughly 85% of the way up the band, after bouncing from the lower band area. The upper band and the $17.2-$17.8 cluster (VWAP, SMA200D) are near-term resistance. [Bullish]
- CMF (20): +0.110, up from -0.34 on Oct 12. It has been above +0.05 for three sessions, which is a clear shift from distribution to accumulation. [Accumulation]
- ADX (14): 25.3, with +DI 30.4 above -DI 18.8. The bears had control until Oct 26, and the DI crossover on Oct 27 handed control to the bulls. ADX is at the 25 threshold and has been flat to slightly rising, which suggests a new uptrend is emerging. [Strong Trend + Bullish direction]
- Volume: 64.30M, with a spike visible on the Oct 27 breakout candle, well above the recent average. The rally was on heavy volume, which is a sign of real buying. The Oct 30 pullback candle to $16.76 shows some profit-taking. [Bullish — volume confirms the breakout]
DIVERGENCES & TRENDS
- No bearish RSI divergence is visible. RSI peaked at 65 while price peaked at $17.61, and both pulled back together.
- The earlier downtrend into mid-October made lower lows, with RSI bottoming at 25.7. The bounce from that capitulation low on a volume spike is a classic reversal signal.
- Price is reclaiming the moving averages. It is now above EMA21, EMA55 ($16.35) and SMA50D ($16.58).
- Price remains below VWAP ($17.21) and SMA200D ($17.79). SMA50D ($16.58) is also below SMA200D, so the death cross is still in effect. This is the main long-term headwind.
- MACD bullish crossover, +DI/-DI crossover and CMF flip all occurred together around Oct 27-28, which is strong confluence.
- EMA21 is converging on EMA55 and could cross within 1-2 weeks if price holds.
- The Oct 30 candle (-4.8%) is a pullback from $17.61 and looks like a retest of the breakout, not a reversal.
CHART PATTERNS
- Bullish Falling Wedge / Bullish Expanding Triangle (reversal): The decline from late August to mid-October, with a series of lower highs and lows and then a sharp breakout, fits a falling-wedge-type reversal. The Oct 27 gap-up and surge is the breakout.
- Longer-term range: Since February, price has been range-bound roughly $14-$19.50, with the SMA200D declining overhead. The key overhead supply zone is $17.2-$18.0 (VWAP, SMA200D, prior swing highs).
- Measured move: The wedge height of about $3 from the high of roughly $17.5-$18 to the $14.2 low projects to about $17.5-$18.5 on a breakout. This is consistent with the 200-day SMA and prior resistance, so the pattern is a bullish reversal that may stall in that zone.
POTENTIAL SCENARIOS
- Scenario 1: Bullish Breakout Continuation — Price holds the $16.0-$16.35 retest zone (EMA55, SMA50D) and pushes through VWAP and the 200-day SMA, with EMA21 crossing above EMA55. Trigger: daily close above $17.80 (above SMA200D and the Oct 29 high of $17.61). Target: $18.50-$19.00. Invalidation: daily close below $15.80 (EMA21). (50% probability)
- Scenario 2: Bearish Rejection at Resistance — The bounce fades at the VWAP/SMA200D zone, and price falls back to retest the October lows as the death cross and downtrend resume. Trigger: failure at $17.3-$17.8 and a close below $15.80. Target: $14.50-$15.00. Invalidation: close above $17.80. (25% probability)
- Scenario 3: Neutral Consolidation — Price chops between SMA50D support (~$16.0) and VWAP/SMA200D resistance (~$17.5-$17.8) as the indicators cool off. Trigger: failure to break either side. Target: $16.20-$17.40. Invalidation: close outside $15.80-$17.80. (25% probability)
PRICE TARGETS
- Target Price: $17.60 (48 days, Dec 19, 2026)
- Expected Range: $14.90 to $19.40 (width $4.50, about 26.8% of current price, consistent with the 18-30% guidance for a 48-day horizon)
- Key Levels: Support at $16.35 (EMA55, with SMA50D at $16.58 just above it and EMA21 at $15.82 below), Resistance at $17.79 (SMA200D)
OVERALL BIAS
OVERALL BIAS: BULLISH - A fresh MACD crossover, a +DI/-DI flip with ADX at 25, a CMF shift to accumulation and a heavy-volume breakout off the oversold low outweigh the headwinds. The main risk is the VWAP/SMA200D resistance cluster at $17.2-$17.8, with the SMA50D still below the SMA200D.
This is educational analysis and not financial advice.