SMH 48-day bearish forecast — Nov 1, 2026
- Bias: Bearish
- Timeframe: 48 days (made Nov 1, 2026, target date Dec 18, 2026)
- Price at analysis: $522.49
- Price target: $497.00
- Expected range: $458.00 – $538.00
- Result: Pending — graded after the close on Dec 18, 2026
Get a free AI analysis of SMH today
Analysis
TECHNICAL INDICATORS
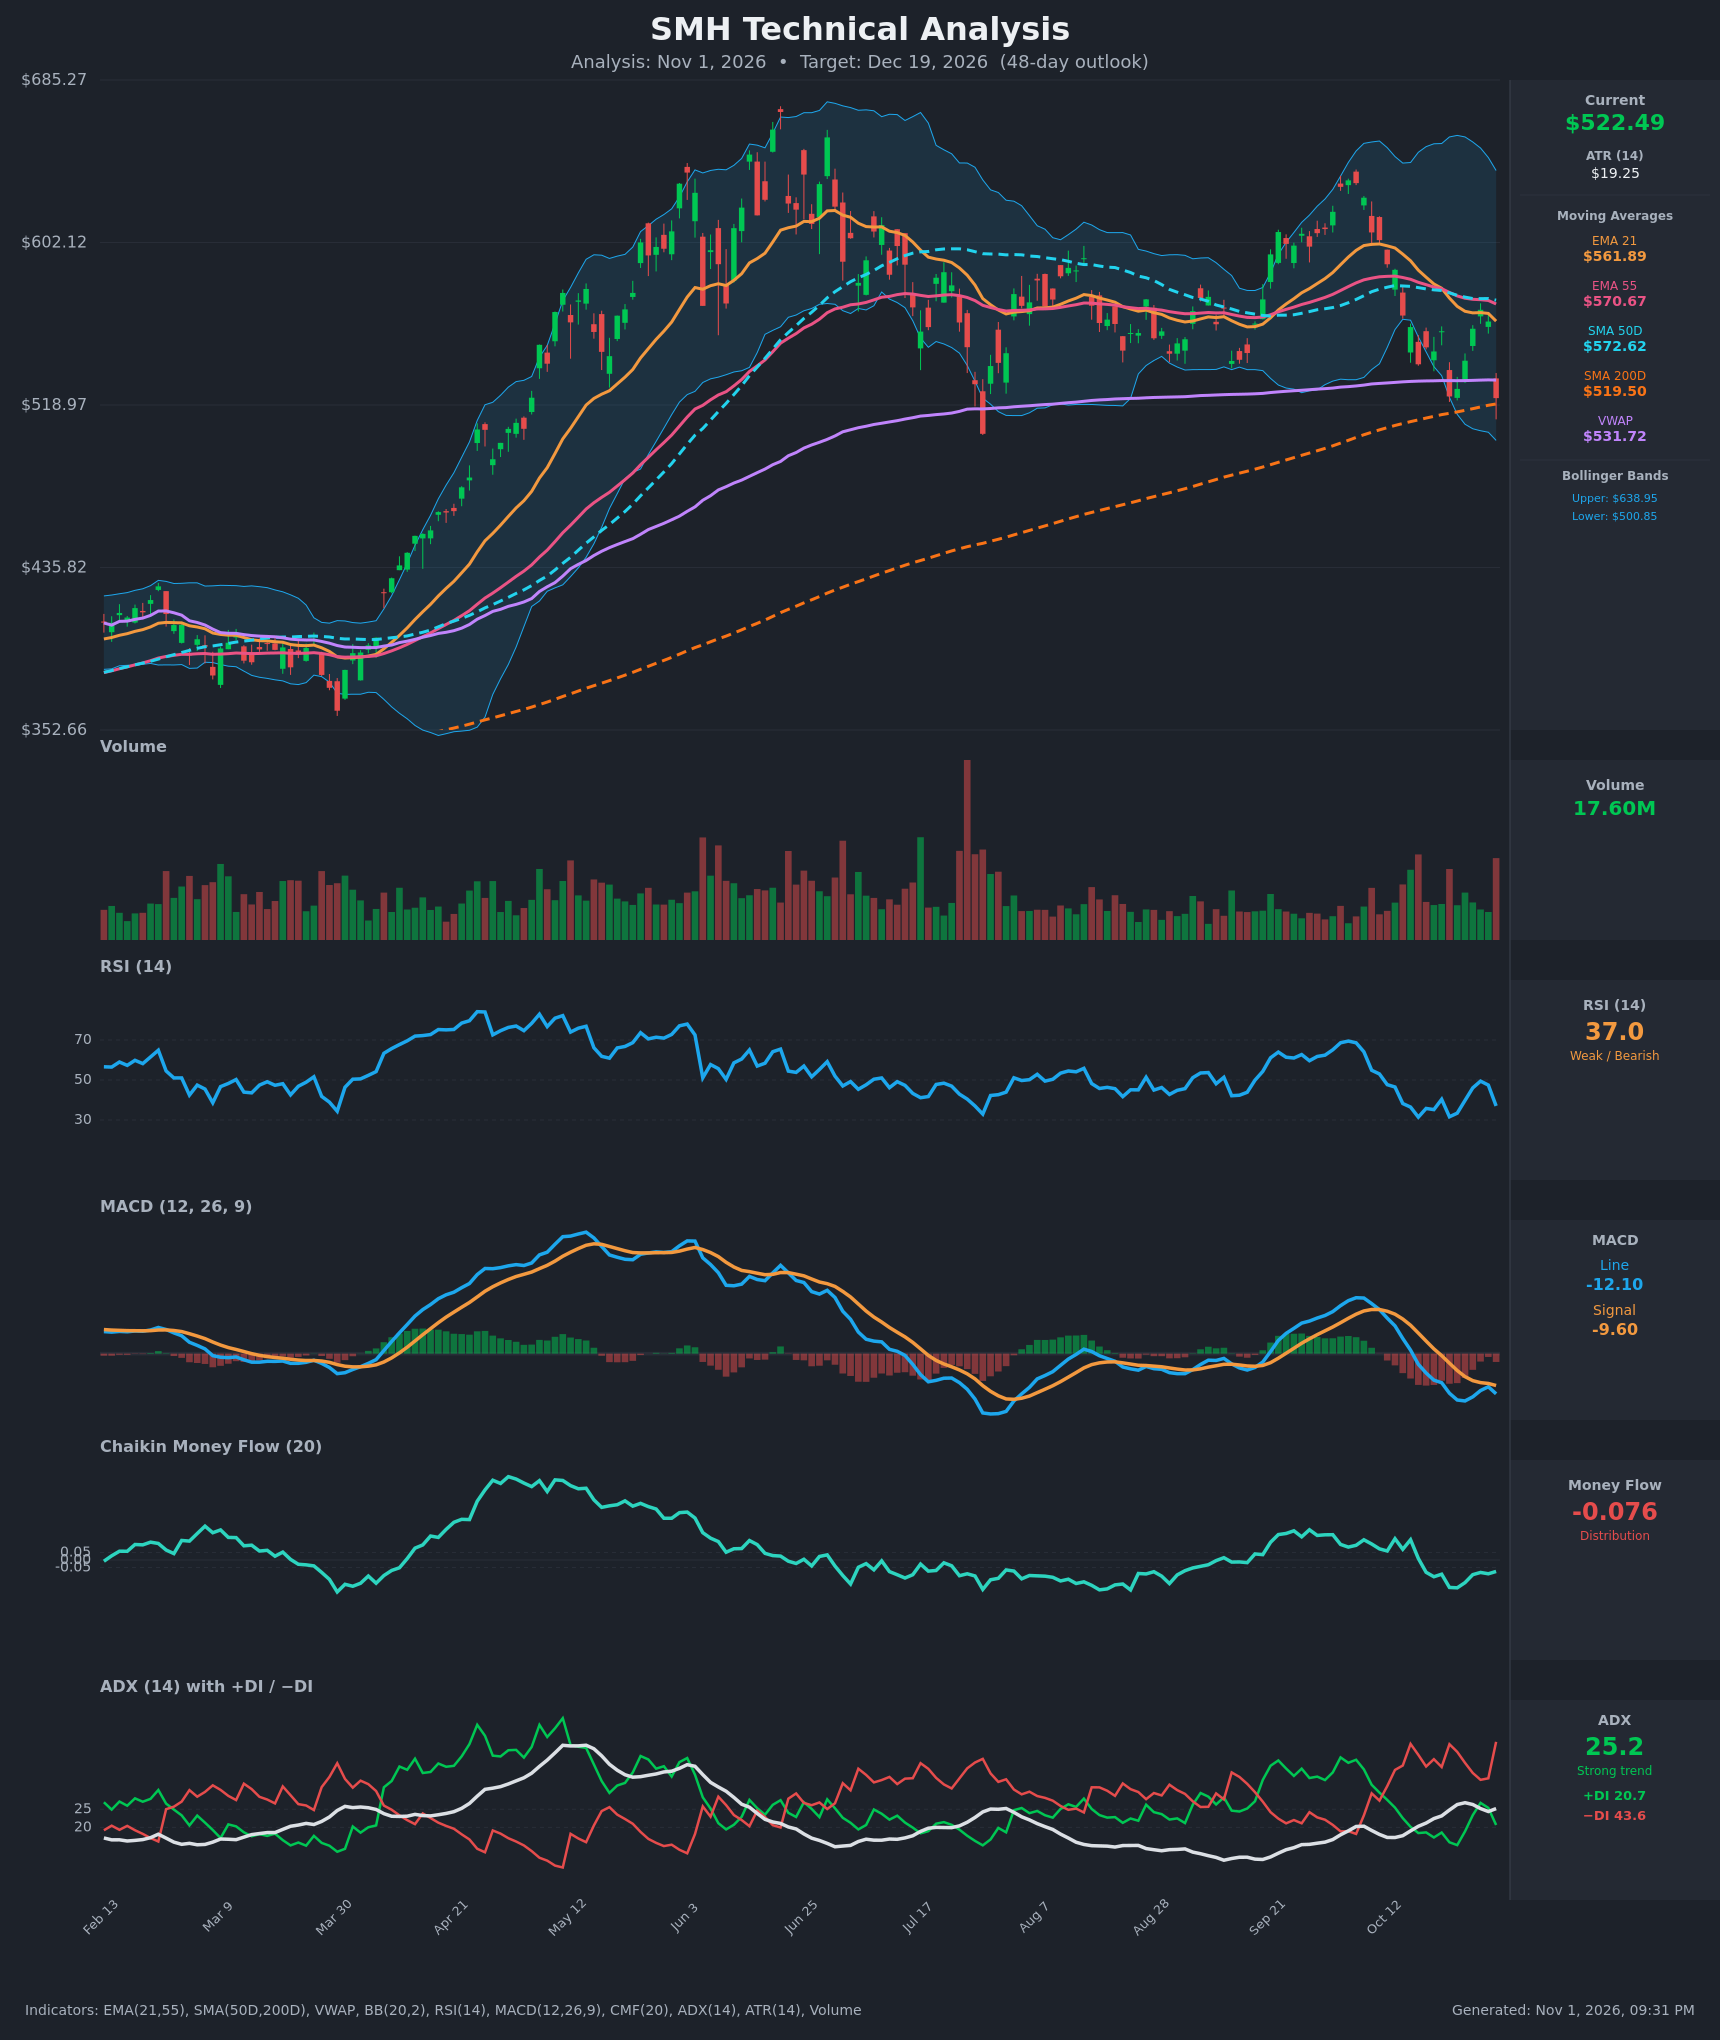
- RSI (14): 37.04, down from 47.5 two sessions ago and close to the 31 oversold low of Oct 16. It is weak but not yet oversold, so there is room to fall further. Rallies have stalled below 50 (49.4 on Oct 28), which is a bearish regime. [Bearish]
- 20 EMA (EMA 21): $561.89, with price about 7% below it. EMA 21 is also below EMA 55 ($570.67). The bearish cross happened around Oct 22, and the EMA is now rolling over and acting as resistance. [Bearish]
- MACD: Line -12.10 is below Signal -9.60, and both are below zero. The line crossed below the signal around Oct 16 and the histogram is negative. The line had begun to recover (-9.97 on Oct 29) but rolled over again with the latest sharp drop. [Bearish]
- Bollinger Bands (20): Price at $522.49 sits in the lower third of the bands (lower $500.85, upper $638.95), about $21.6 above the lower band. The bands are wide, so volatility is elevated. The Oct 30 candle shows a sharp drop, and a walk down the lower band is possible. [Bearish]
- CMF (20): -0.076, below the -0.05 threshold and slipping from the brief positive readings of mid-October. It has been negative for about 10 sessions, which points to persistent distribution. [Distribution]
- ADX (14): 25.2 and rising from 17 two weeks ago, so a trend is establishing. −DI at 43.6 is far above +DI at 20.7, so bears are firmly in control. [Strong Trend – Bearish]
- Volume: 17.60M on the latest bar is the highest in recent weeks, on a -7% down day (a $561.67 to $522.49 close). Heavy volume on a decline confirms selling pressure, though it could also mark a capitulation-style flush. [Bearish – distribution/high-volume breakdown]
Other levels:
- VWAP: $531.72, now overhead and acting as minor resistance.
- SMA200D: $519.50, essentially at price. This is the last major long-term support.
- SMA50D: $572.62, which is also above price.
DIVERGENCES & TRENDS
- There is no clear bullish RSI divergence. RSI made a higher low (31.4 on Oct 16, then 31.6 on Oct 22) while price made a lower low ($523 vs $540), which is a mild bullish divergence. It is weak because RSI has now rolled over to 37 and MACD and CMF are making lower lows.
- MACD has been making lower lows since the early-October peak, in line with price. CMF has stayed below zero since July, which means distribution has persisted even through the September bounce.
- The ADX/DI structure is bearish. −DI spiked from 33 to 43.6 in one session and the ADX is climbing back above 25.
- All short- and medium-term moving averages are stacked above price (EMA 21, EMA 55, SMA 50, VWAP). The only support left is the rising SMA200 at $519.50.
- The long-term trend is still up because SMA50 is above SMA200 (no death cross). The 50/200 spread is narrowing and could converge if price stays weak.
- The September rally failed at a lower high (~$610) than the June peak (~$665).
CHART PATTERNS
- Bearish Head and Shoulders (developing): The June peak near $665 is the head. The earlier rally in May and the lower high in September–October (~$600–610) act as the shoulders. The neckline is roughly $510–520, where the July low and the current SMA200 sit. A confirmed close below about $500–510 would complete the pattern. The full measured move (~$145) implies a target far below, near $370, but this is a very long-range projection. A partial move toward $460–480 is more realistic within 48 days.
- Double-top / lower-high structure: The Sep–Oct high failing below the June–July highs reinforces the distribution.
- Range breakdown: Price had been consolidating between about $520 and $600 since July. The break toward the bottom of that range is bearish unless the SMA200 and lower band hold.
POTENTIAL SCENARIOS
- Scenario 1: Bearish Neckline/SMA200 Breakdown — Price loses the SMA200 and the July low area, then walks down the lower Bollinger Band as −DI stays dominant and MACD and CMF stay negative. Trigger: daily close below $500.85 (lower band) on volume. Target: $470–$480, with an extension toward $455. Invalidation: daily close back above $562 (EMA 21). (55% probability)
- Scenario 2: Bullish Oversold Bounce / SMA200 Hold — The SMA200 and lower band hold, RSI curls up from the low 30s, and price recovers toward the declining EMAs. Trigger: close above VWAP $531.72 and then $562. Target: $560–$575 (EMA 21, EMA 55 and SMA 50 cluster). Invalidation: close below $500. (28% probability)
- Scenario 3: Neutral Chop Around the SMA200 — Price whipsaws between about $495 and $545 as the strong volume flush is digested, with no clear resolution. Trigger: alternating closes around VWAP and SMA200 with ADX fading below 25. Target: $510–$530. Invalidation: close above $562 or below $490. (17% probability)
PRICE TARGETS
- Target Price: $497.00 (48 days, to Dec 19, 2026)
- Expected Range: $458.00 to $538.00 (width $80, about 15.3% of current price, consistent with the 30–60 day guidance of 12–18%)
- Key Levels: Support at $519.50 (SMA200D), with deeper support at $500.85 (lower Bollinger Band). Resistance at $561.89 (EMA 21), with minor resistance at $531.72 (VWAP).
OVERALL BIAS
OVERALL BIAS: BEARISH - Price is below every short- and medium-term moving average. MACD is negative below its signal line, and CMF shows distribution. −DI (43.6) is far above +DI (20.7) with ADX rising through 25, and a high-volume breakdown is testing the SMA200. A lost SMA200 and neckline would open the way to the lower $470s–$480s, though an oversold bounce is the main risk.
This is educational analysis and not financial advice.