SOXS 48-day bearish forecast — Nov 1, 2026
- Bias: Bearish
- Timeframe: 48 days (made Nov 1, 2026, target date Dec 18, 2026)
- Price at analysis: $52.08
- Price target: $46.00
- Expected range: $41.50 – $50.80
- Result: Pending — graded after the close on Dec 18, 2026
Get a free AI analysis of SOXS today
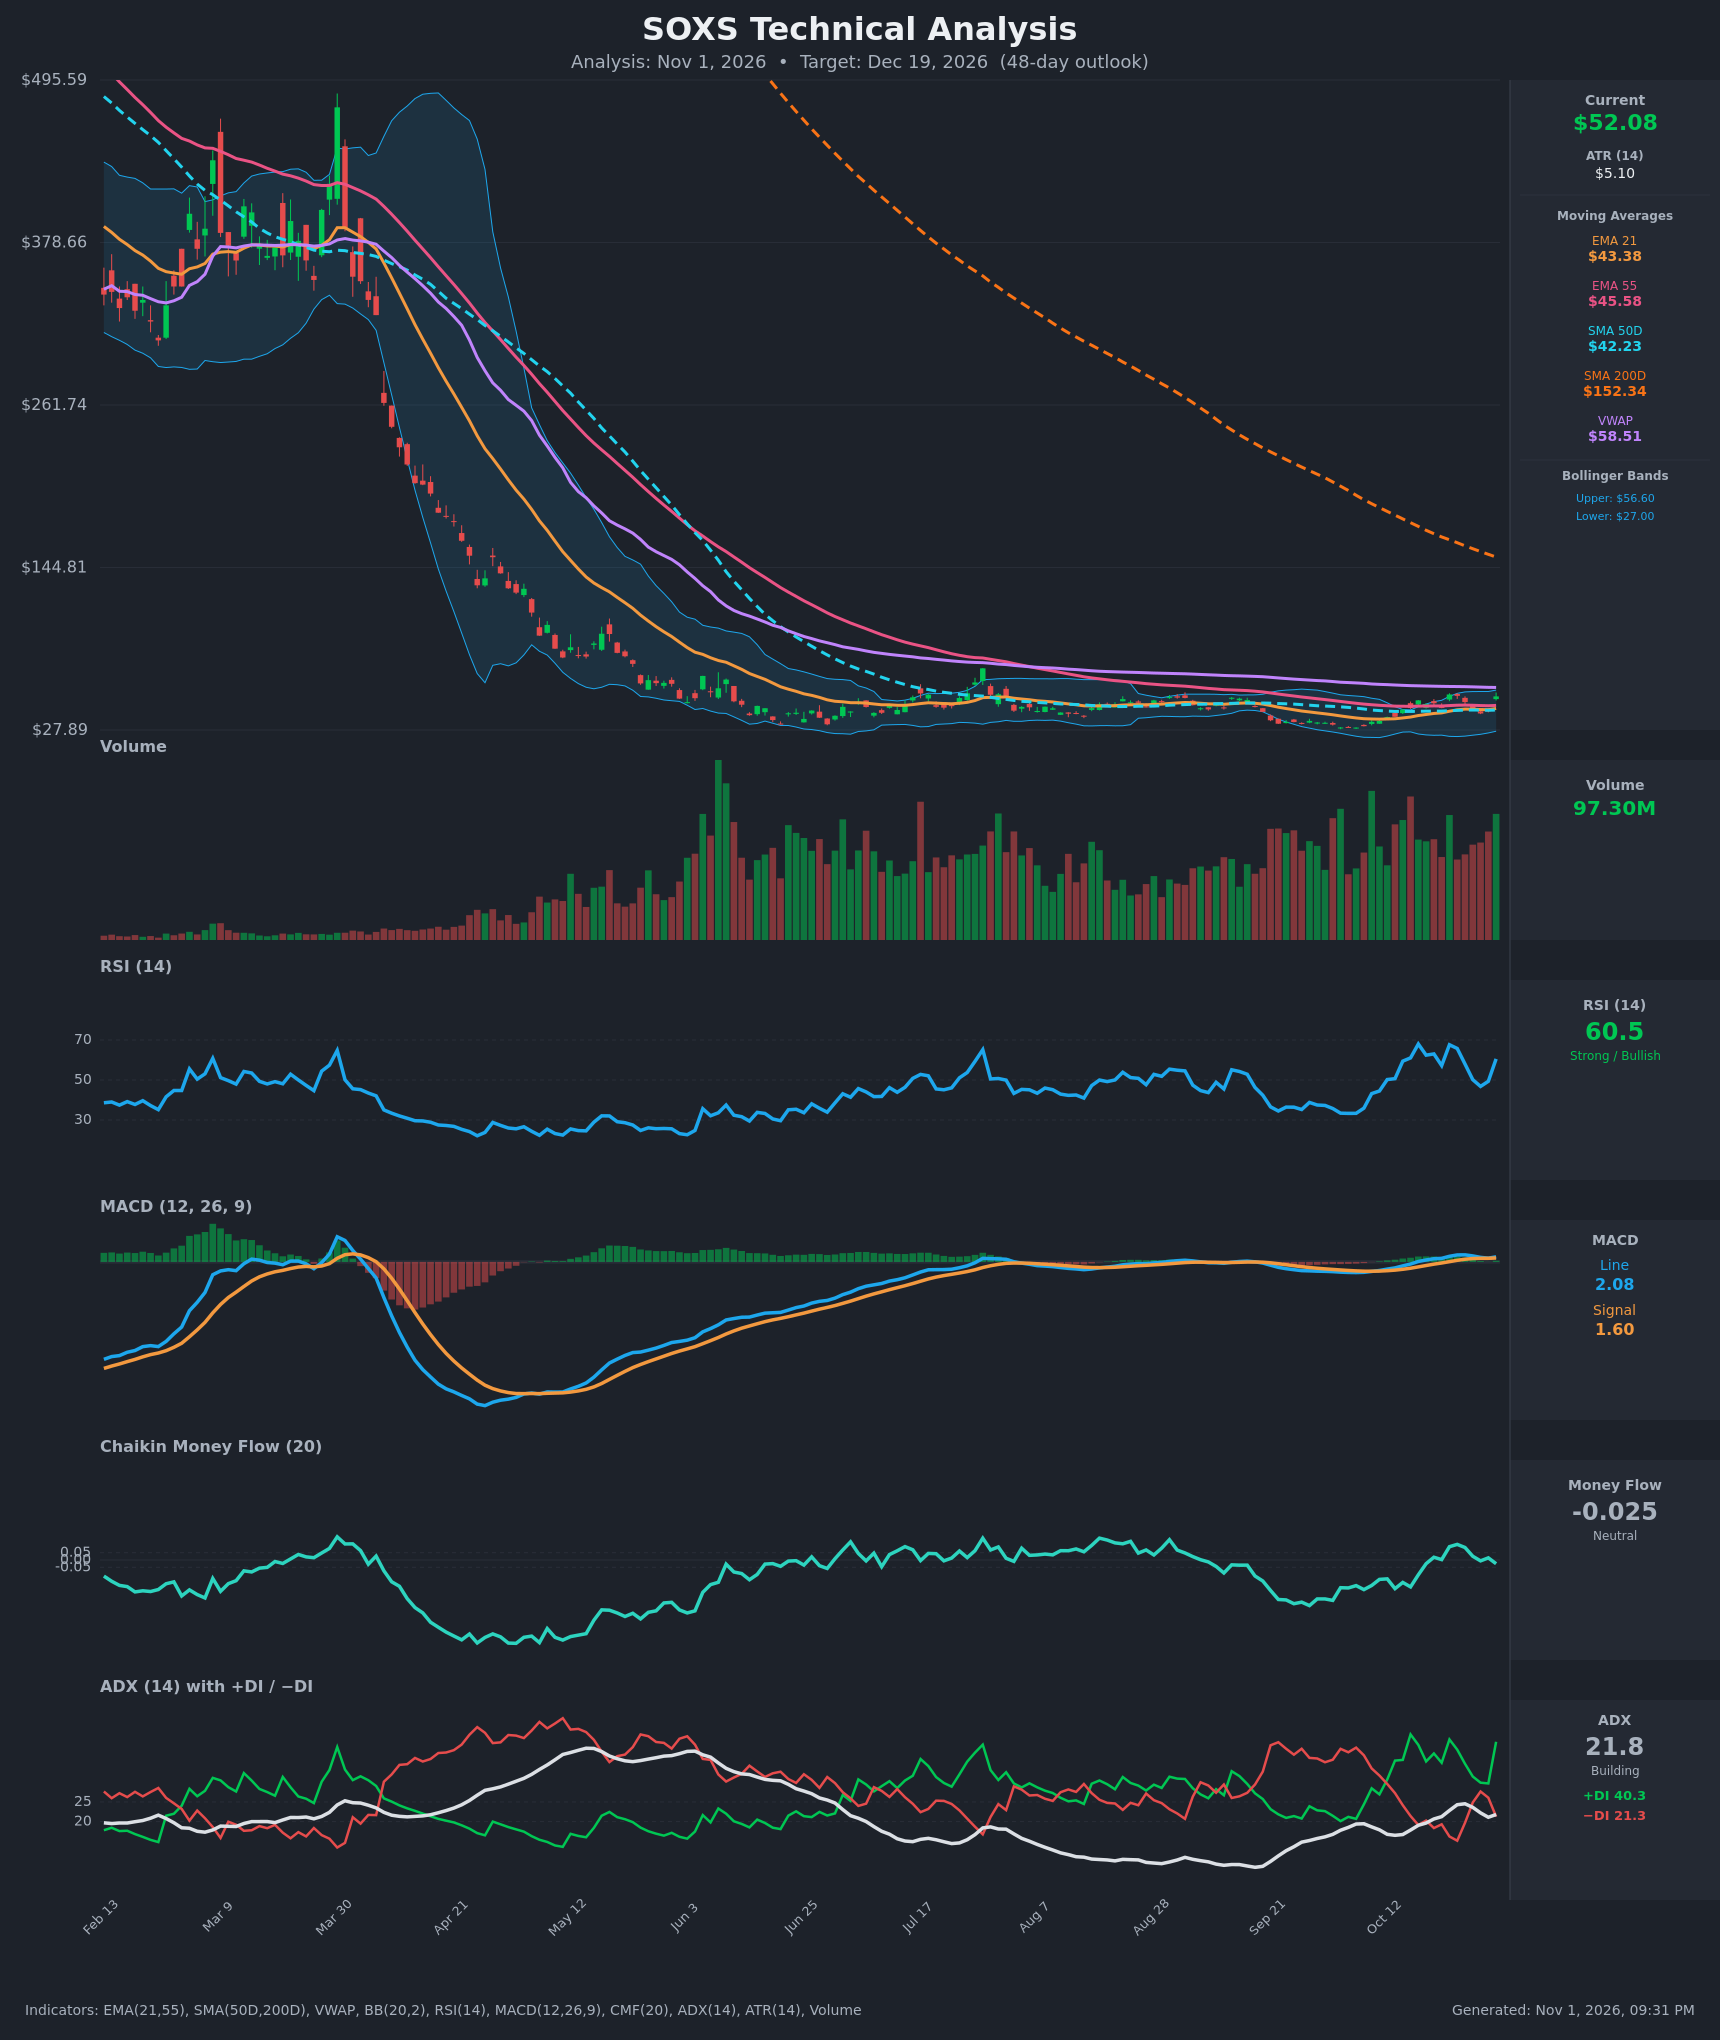
Analysis
TECHNICAL INDICATORS
- RSI (14): 60.55, up from 49.4 in one session after a 25% single-day jump. It is strong but not overbought. It has peaked at 67-68 twice in the past two weeks and then rolled over. [Bullish]
- 20 EMA (EMA 21 = $43.38): Price at $52.08 is about 20% above it, which makes it dynamic support. The EMA21 is still below the EMA55 ($45.58), so there is no bullish EMA crossover yet. Price is also stretched far above the mean. [Bullish]
- MACD: Line 2.08 is above signal 1.60, a bullish crossover that has held since Oct 22. The line is a lot lower than a few days ago and the signal gap is narrow, so the histogram is small and positive. The line peaked at 2.89 on Oct 26 and is only now turning up again. [Bullish]
- Bollinger Bands (20): Upper $56.60, lower $27.00, so the bands are very wide, a sign of high volatility. Price is in the upper third, about $4.50 below the upper band. Prior pushes into the $49-53 area were sold within 2-4 sessions. [Neutral]
- CMF (20): -0.025 is inside the ±0.05 neutral band. It was slightly positive (+0.106) on Oct 23 and has faded. Buying is not confirmed by money flow despite the price spike. [Neutral]
- ADX (14): 21.8 and rising, but below 25. +DI (40.3) is well above −DI (21.3), so bulls are in control. The trend is only just building, and ADX peaked at 24.5 earlier in the month and failed to exceed 25. [Weak Trend, bullish direction]
- Volume: 97.3M, near the high end of the recent range. The volume bars show repeated high-volume spikes on both up and down days, which points to a choppy, two-way market. The up-day volume on the Oct 30 rally supports the bounce but does not prove a trend change. [Neutral to mildly bullish]
DIVERGENCES & TRENDS
- Long-term trend: Price is far below the SMA200D ($152.34, still falling about $2 per day). The SMA50D ($42.23) is far below the SMA200D, so a death cross is long established. The big picture is a dominant downtrend: price fell from about $495 to about $28.
- Recent base: Since June, price has ranged around $28-$40 and has just pushed out of it. The EMA21, EMA55 and SMA50D are converging at $42-$46 in a tight cluster, which is a key pivot zone.
- Price vs VWAP: Price is still below the anchored VWAP ($58.51), which acts as overhead resistance.
- Whipsaw behavior: Closes went 49.23 → 46.63, 53.45 → 39.78, and now 41.68 → 52.08. Every spike in the last two weeks has been at least partly retraced within days.
- Momentum: RSI and MACD are positive but have not made meaningful higher highs. The MACD line peaked at 2.89 while price hit $53.45 and is now at 2.08, with price at a similar level. This is a mild lack of confirmation.
- Crossovers: The MACD bullish crossover occurred Oct 22 and the +DI/−DI bullish stack is intact. There is no golden cross or EMA21/EMA55 bullish cross.
CHART PATTERNS
- Bearish Double Top (reference diagram): The $53.45 high on Oct 22 and the $52.08 close on Oct 30, with a trough near $39.78 in between, form a rough double-top shape. A confirmed breakdown below $39.78 would target about $26-$28, which coincides with the old lows.
- Bearish Descending channel / long-term decline: The long-term structure is a heavy downtrend with a flat base at $28-$40. A decisive break above $56.60 (upper Bollinger band) would be the first sign the base is turning into a reversal, in the style of a Bullish Double Bottom or Triple Bottom.
- Reading: The range is $37-$53. Price is at the top of it, with resistance at $53.45, so risk/reward favors fading the rally over chasing it. SOXS is also a 3x leveraged inverse ETF, so volatility decay works against holders and pulls it down over time.
POTENTIAL SCENARIOS
- Scenario 1: Bearish Range Fade — Price fails again near the $53.45 double-top and the VWAP, then drifts back toward the EMA cluster as the latest spike gets retraced, as happened on Oct 16 and Oct 22. Trigger: rejection at $52-$54 or a daily close below $47.98. Target: $44-$46, with an extension to $39-$40 if the EMA21 breaks. Invalidation: daily close above $56.60. (50% probability)
- Scenario 2: Bullish Breakout — Momentum persists (MACD above signal, +DI far above −DI). ADX pushes above 25 and price clears $53.45 and the upper Bollinger band, heading for the VWAP. Trigger: close above $53.50 on strong volume with CMF above +0.05. Target: $58.50-$62. Invalidation: close back below $45.58 (EMA55). (33% probability)
- Scenario 3: Neutral Chop — Price oscillates in the $42-$53 range with no resolution, given the weak ADX and neutral CMF. Trigger: closes between $43.40 and $53.40. Target: $47-$50. Invalidation: close outside $40-$56. (17% probability)
PRICE TARGETS
- Target Price: $46.00 (48-day horizon)
- Expected Range: $41.50 to $50.80 (width $9.30 ≈ 17.9% of the current price, consistent with the 30-60 day guidance)
- Key Levels: Support at $43.38 (EMA21), Resistance at $53.45 (Oct 22 high)
OVERALL BIAS
OVERALL BIAS: BEARISH - Price is at the top of a $37-$53 range after a 25% one-day spike, with CMF neutral, ADX below 25, price below VWAP, and every recent spike retraced within days. The long-term downtrend and leveraged-ETF decay add to the bearish weight, though near-term momentum (MACD, +DI) is positive and keeps conviction modest.
This is educational analysis and not financial advice.