SOXL 48-day bearish forecast — Nov 1, 2026
- Bias: Bearish
- Timeframe: 48 days (made Nov 1, 2026, target date Dec 18, 2026)
- Price at analysis: $77.05
- Price target: $69.00
- Expected range: $63.00 – $77.00
- Result: Pending — graded after the close on Dec 18, 2026
Get a free AI analysis of SOXL today
Analysis
TECHNICAL INDICATORS
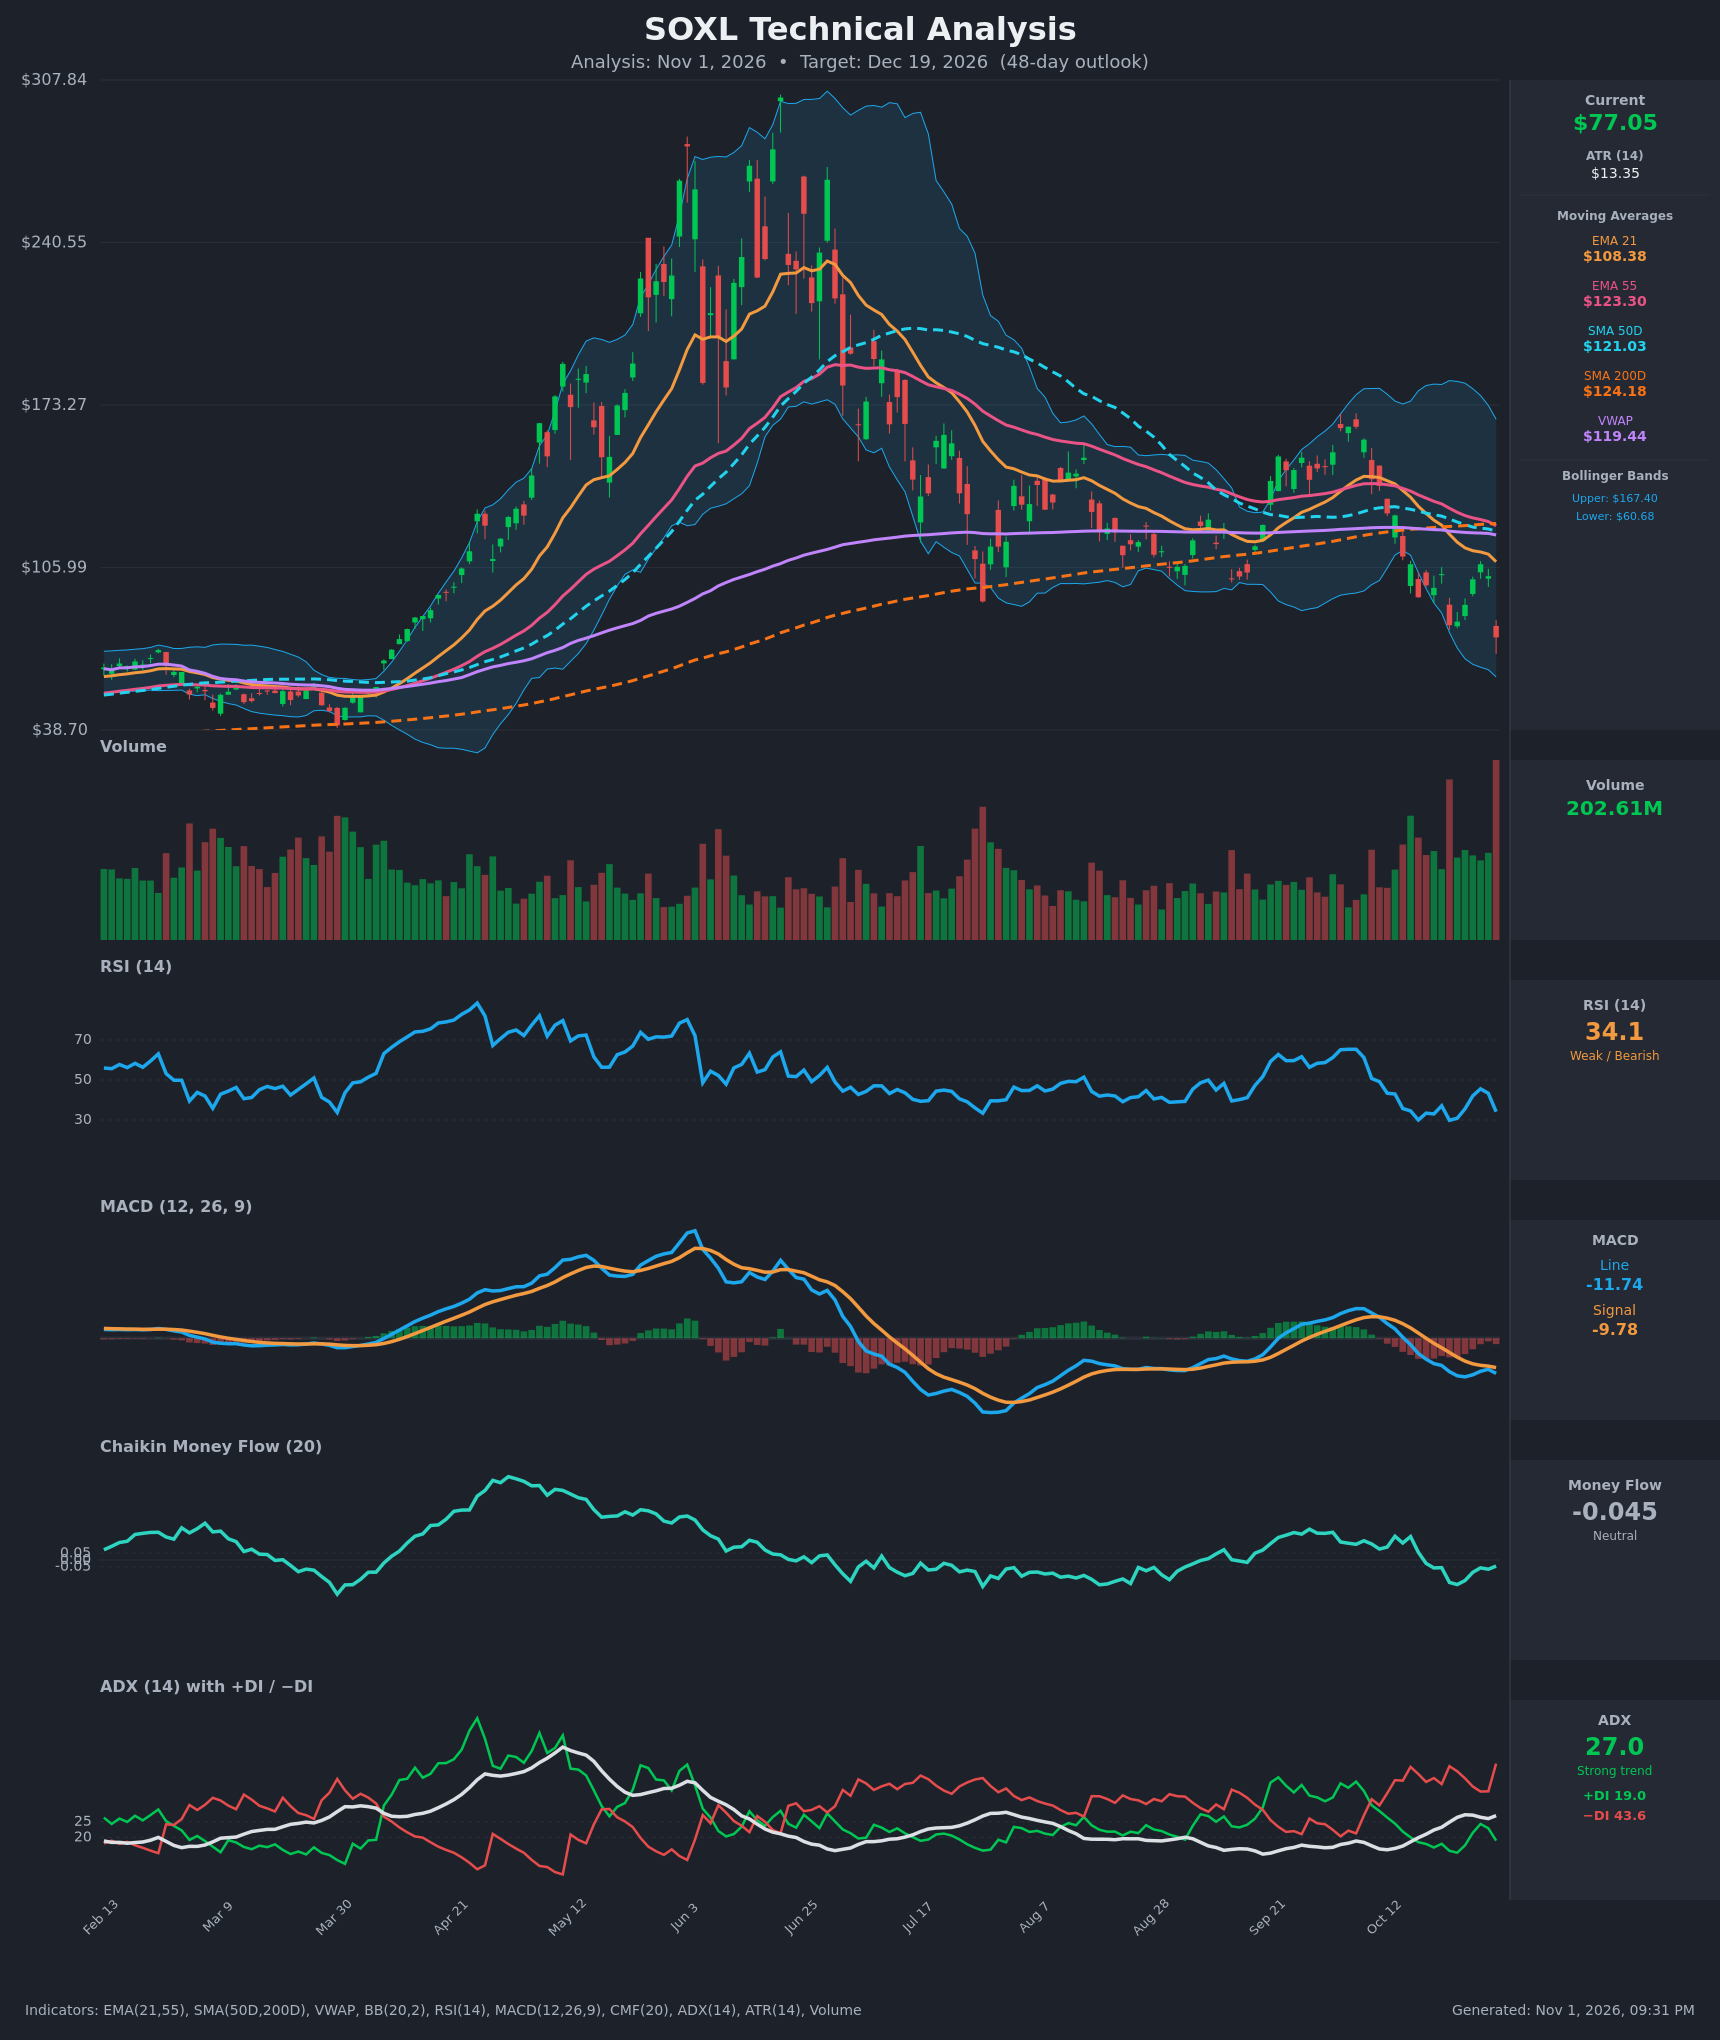
- RSI (14): 34.14, down from 45.6 on Oct 28 and approaching oversold (<30), which it touched on Oct 16 and Oct 22. Bounces from the 30 area have failed to reach 50, so momentum is still pointing down. [Bearish]
- 20 EMA (EMA 21 = $108.38): Price at $77.05 is about 29% below it. EMA21 is below EMA55 ($123.30) after crossing down around Oct 14, and the slope is steeply negative. The EMA21 is overhead resistance. [Bearish]
- MACD: Line -11.74 is below signal -9.78, so the histogram is negative. The bearish cross happened around Oct 19, and the line has made a new low after a brief attempt to narrow the gap. [Bearish]
- Bollinger Bands (20): Upper $167.40, lower $60.68, so the bands are very wide (volatility is elevated). Price is in the lower third, about $16 above the lower band, after a 25% one-day drop. A band walk is developing, and a test of the lower band is plausible. [Bearish]
- CMF (20): -0.045, in the neutral zone but just short of the -0.05 distribution threshold. It has been negative since Oct 19 and sits at the low end of its recent range. [Neutral]
- ADX (14): 27.0 and rising, up from 16 on Oct 12, so a strong trend is established. −DI (43.6) is far above +DI (19.0), meaning bears are firmly in control. [Strong Trend – Bearish]
- Volume: 202.61M is the highest bar in the displayed window, on a -24.7% red candle (Oct 30). This is heavy selling and a breakdown on high volume. It could be capitulation, but there is no reversal confirmation yet. [Bearish – heavy distribution / possible capitulation]
DIVERGENCES & TRENDS
- There is no bullish RSI divergence. RSI at 34 is above its Oct 22 low of 29.9 while price is well below that day's $82.11 close, so price made a lower low with a higher RSI. This is a mild bullish divergence and a sign of fading downside momentum, but it is unconfirmed.
- MACD is making new lows (-11.74 vs -12.88 on Oct 26). The line is still below signal and has no bullish cross.
- Death cross: SMA50D ($121.03) crossed below SMA200D ($124.18) around Oct 27, a major bearish long-term signal. Price is far below SMA200D, so the long-term trend is down.
- EMA21 < EMA55 since Oct 14. VWAP ($119.44) is far above price, so most volume-weighted buyers are underwater.
- ADX rose from the teens to 27 while −DI dominates. The DI spread of 24.6 points shows a clear bearish trend.
- Price lost the $100–$150 consolidation range (Aug–Oct), and lower highs have formed since the June peak near $300.
CHART PATTERNS
- Bearish range breakdown (similar to a Bearish Triple Top or Rectangle from the reference): price chopped between about $100 and $150 from July to mid-October, then broke down on Oct 14 and again on Oct 22 and Oct 30. The measured move is the range height (~$50) subtracted from the ~$100 breakdown level, giving a target near $50–$55.
- Broader topping structure: the June peak (~$300), the Sep lower high (~$155) and the Oct breakdown resemble a large head-and-shoulders or lower-high reversal. The SMA death cross supports this reading.
- Counter-risk: there is no confirmed bullish pattern. A short-term Bullish Falling Wedge or double-bottom would need a base near $60–$65 and a recovery above $83.
POTENTIAL SCENARIOS
- Scenario 1: Bearish Trend Continuation — Price stays below the falling EMA21 and tests the lower Bollinger Band, with −DI dominant and ADX rising. Bounces fade near $83–$90. Trigger: a close below $70 and a lower Bollinger Band test at ~$60.68. Target: $60–$65, with an extension toward $50–$55 on a break of the lower band. Invalidation: a daily close above $90.50. (50% probability)
- Scenario 2: Bullish Capitulation Bounce — The 200M-share, -25% day marks a selloff climax. RSI turns up from the low 30s and a short-covering rally reaches the declining EMA21 at ~$105–$108. Trigger: reclaiming $83.50, then $90.50 on rising volume with a MACD histogram turn. Target: $95–$108. Invalidation: a close below $65. (35% probability)
- Scenario 3: Neutral Base Building — Price consolidates in the $63–$85 zone as volatility compresses. Trigger: several sessions of narrow ranges with ADX falling. Target: $70–$80. Invalidation: a close outside $60–$90. (15% probability)
PRICE TARGETS
- Target Price: $69.00 (48-day, Dec 19, 2026)
- Expected Range: $63.00 to $77.00 (width $14.00, about 18% of current price). Note that SOXL's ATR is about 17% of price, so breaks of either edge are plausible.
- Key Levels: Support at $60.68 (lower Bollinger Band), Resistance at $83.50 (Oct 23 close and prior swing zone)
OVERALL BIAS
OVERALL BIAS: BEARISH - Price is below every moving average, with a death cross, a bearish MACD, −DI (43.6) far above +DI (19.0) and ADX rising through 25. The range breakdown came on record volume. Oversold RSI and the possibility of capitulation make a relief bounce a real risk, but the weight of evidence favors lower prices.
This is educational analysis and not financial advice.