SPY 48-day bearish forecast — Nov 1, 2026
- Bias: Bearish
- Timeframe: 48 days (made Nov 1, 2026, target date Dec 18, 2026)
- Price at analysis: $755.72
- Price target: $745.00
- Expected range: $692.00 – $790.00
- Result: Pending — graded after the close on Dec 18, 2026
Get a free AI analysis of SPY today
Analysis
TECHNICAL INDICATORS
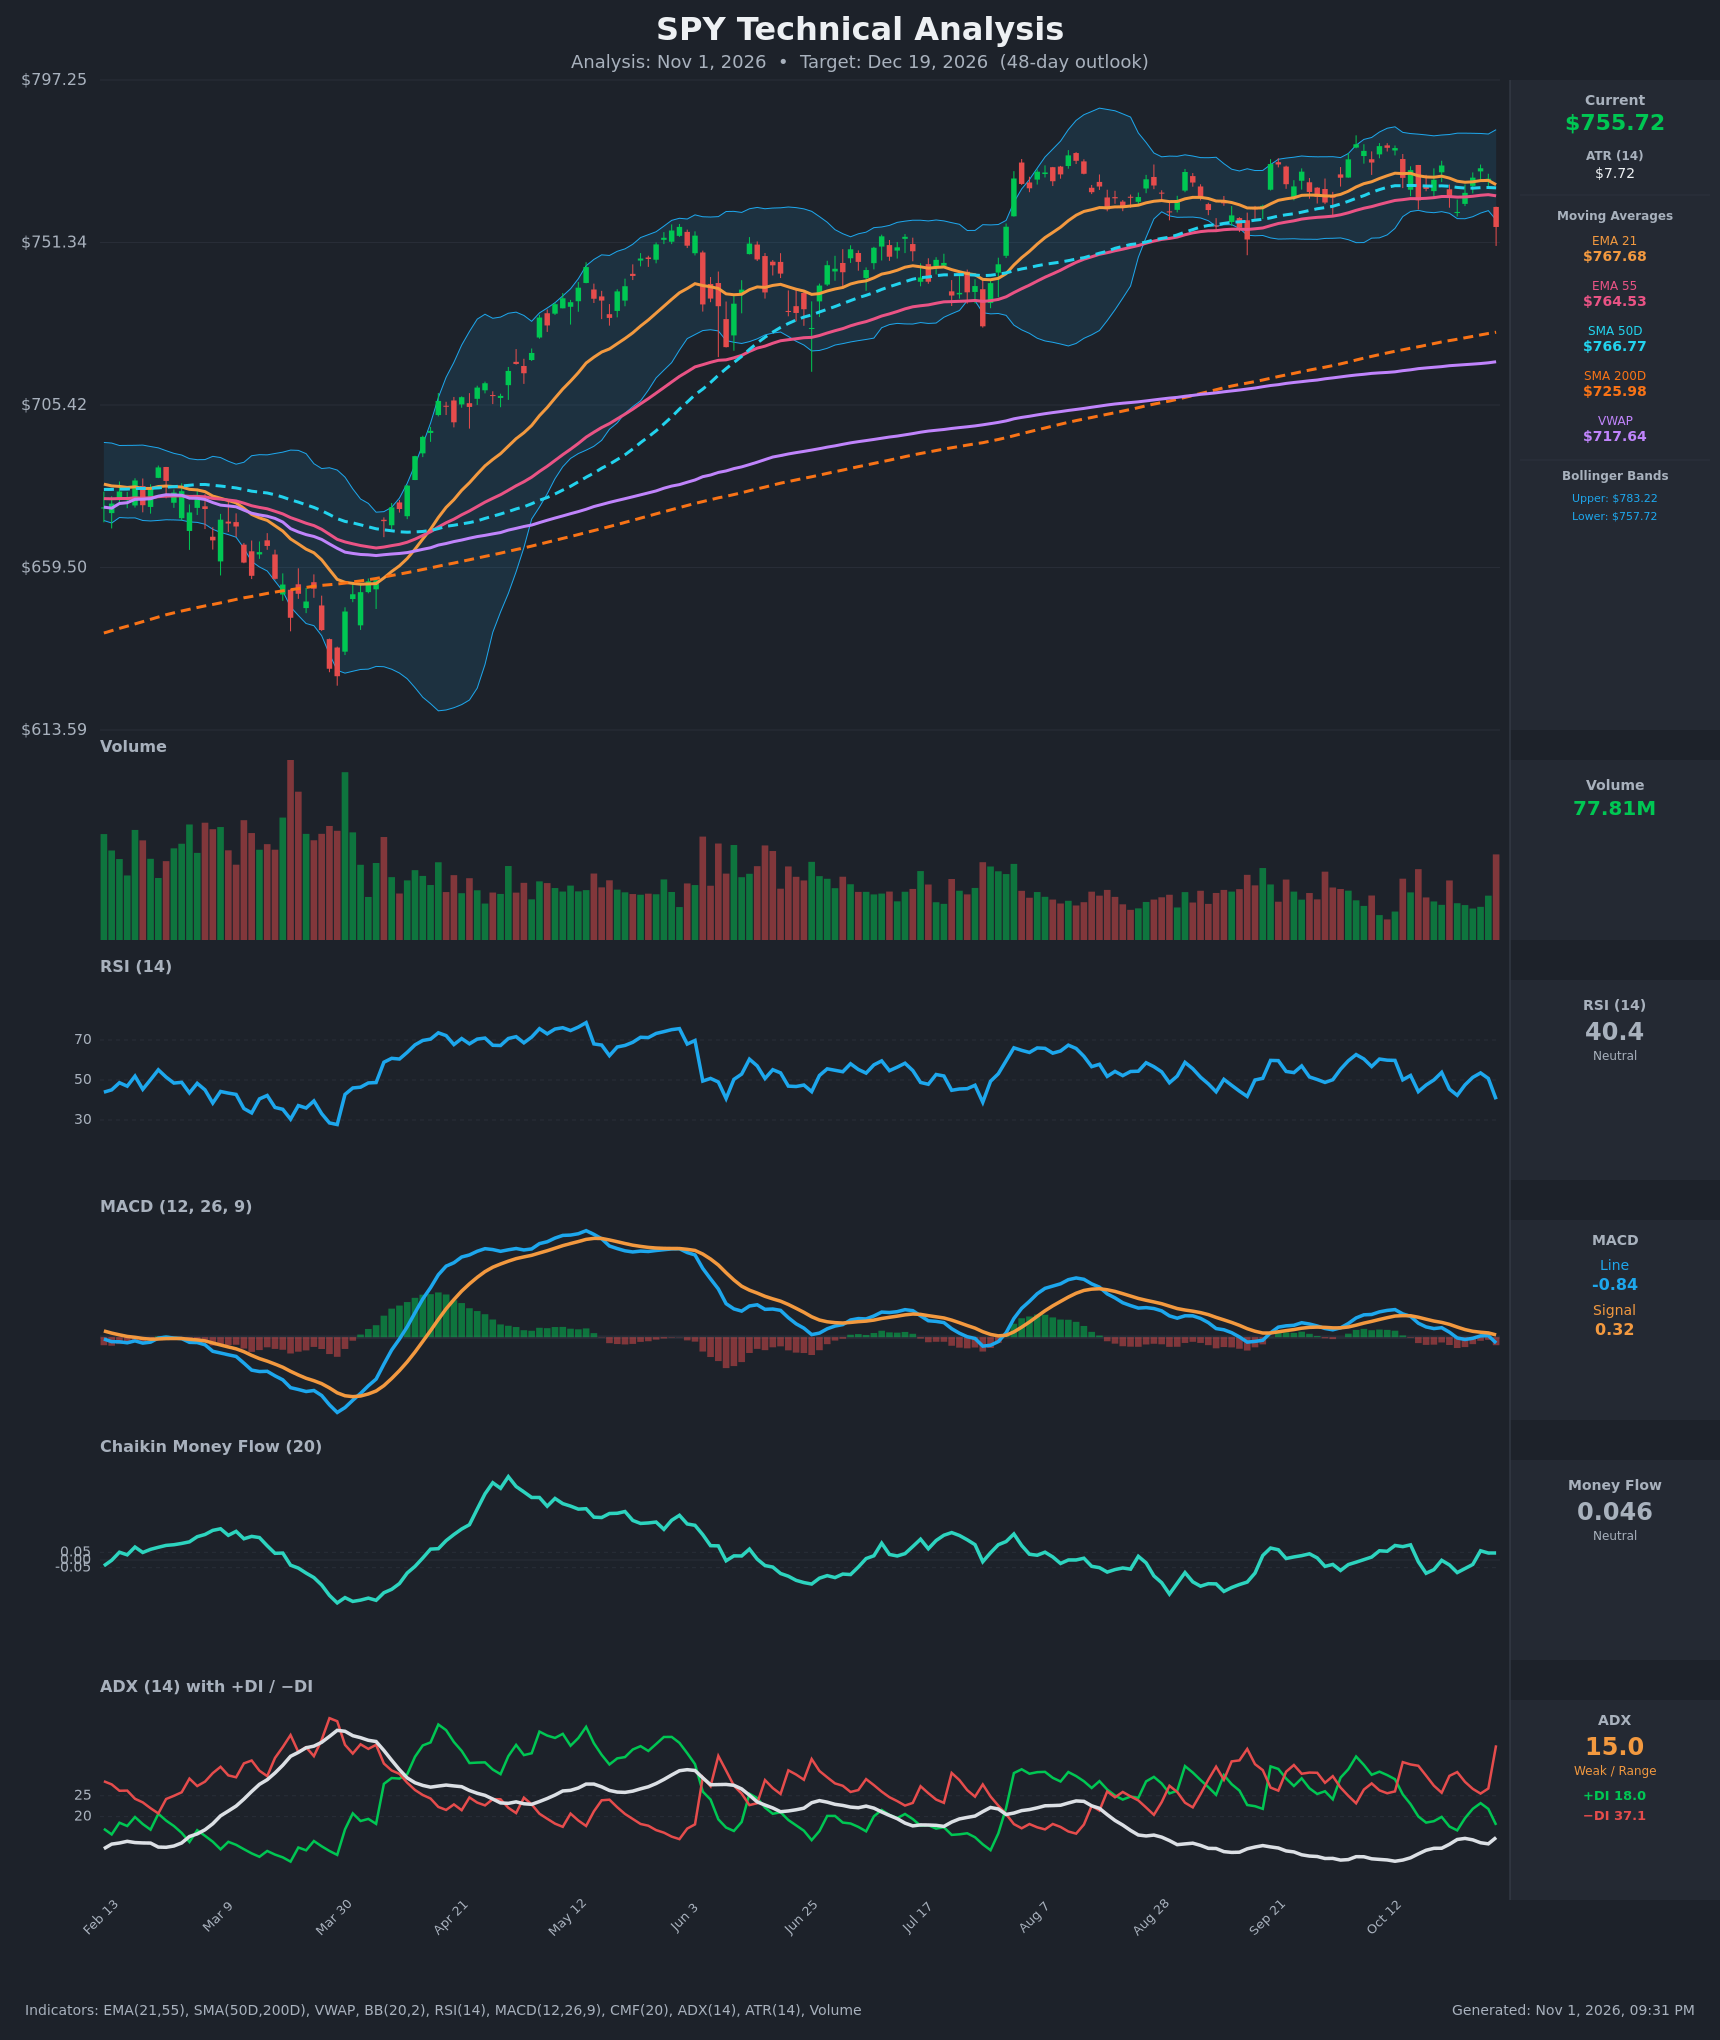
- RSI (14): 40.36, down sharply from 50.8 the prior day and 59.9 on Oct 12. Momentum has rolled over and is approaching the 30-40 zone, but it is not yet oversold. [Bearish]
- 20 EMA: The 21 EMA is $767.68 and price at $755.72 is about 1.6% below it, so it now acts as resistance. Price also lost the EMA55 ($764.53) and SMA50D ($766.77), which are clustered tightly just overhead. [Bearish]
- MACD: The line is -0.84 against a signal of +0.32, a fresh bearish crossover on Oct 30 (the line was +0.22 vs +0.62 the day before). The histogram has flipped negative and is falling, and the line has dropped from +4.0 on Oct 13. [Bearish]
- Bollinger Bands (20): The bands run $757.72 to $783.22 and price closed just below the lower band at $755.72. This is a volatility-driven breakdown from the lower half of a range. It can mean short-term exhaustion and a bounce, but a close outside the band with expanding downside momentum often continues. The bands are fairly narrow, consistent with a consolidation. [Neutral]
- CMF (20): 0.046, just inside the neutral band (-0.05 to +0.05) and slipping. It was around +0.09 to +0.10 on Oct 13-15 and has hovered near zero since. There is no strong accumulation backing a rebound. [Neutral]
- ADX (14): 15.0 (below 20, so a weak trend or range), but it ticked up from 13.5. −DI jumped to 37.1 against +DI at 18.0, so bears are in control on this move. This is a directional shift inside a non-trending environment, and it needs ADX to rise above 20-25 to confirm. [Weak Trend, Bearish bias]
- Volume: 77.81M, the highest bar in recent weeks, on a large red candle (-1.8%). Heavy volume on a down day suggests real distribution or a breakdown attempt rather than drift. [Bearish]
Longer-term context:
- Price is above SMA200D ($725.98) and above VWAP ($717.64), so the long-term uptrend is intact.
- SMA50D is above SMA200D, so there is no death cross. A death cross is not a near-term threat.
- EMA21 is above EMA55, which is still a bullish structure, though the spread is narrowing.
DIVERGENCES & TRENDS
- No bullish divergence: Price has made lower closes in the last two sessions along with lower RSI and MACD, so the indicators confirm price weakness.
- Momentum fading: MACD has declined steadily from +4.0 (Oct 13) to -0.84, while price has chopped between $760 and $778. Momentum weakened first and price is now catching down.
- Crossovers and breaks:
- MACD crossed bearishly on Oct 30.
- Price broke below EMA21, EMA55 and SMA50D in one bar.
- Price closed below the lower Bollinger Band.
- −DI surged above +DI after the two had been roughly converging.
- Trend backdrop: The chart shows a strong rally from the March low (~$630) to the August high, followed by sideways consolidation between roughly $740 and $785 for about three months. ADX has trended down to the mid-teens, confirming a range-bound market. Price now sits at the bottom edge of that range with a bearish break attempt.
CHART PATTERNS
- Primary read: horizontal consolidation (rectangle). Price has ranged roughly $740 to $785 since August. The latest bar is a high-volume break of the range's lower-half structure (below all of EMA21, EMA55, SMA50D).
- Loose resemblance to a Bearish Triple Top / Double Top. There are repeated failures near $775-785 in September and October (highs around $778 on Oct 12-13 and $772 on Oct 28). This is not a clean match, and a confirmed bearish break needs a close below the range low near $740.
- Measured-move target: The rectangle is about $45 tall, so a break below $740 would project to roughly $695. That is a tail scenario, because the SMA200D at ~$726 is a strong confluence support below.
- Significance: The pattern is only moderately reliable because ADX is weak. Expect chop with a downward skew rather than a clean trend.
POTENTIAL SCENARIOS
- Scenario 1: Bearish Range Breakdown / Pullback to the 200-day — The high-volume breakdown below the EMA cluster, the MACD cross and −DI dominance lead to a test of the lower range and the SMA200D area. Trigger: daily close below $750, then below $740. Target: $725-$740, with an extension toward $705-$715 if $725 fails. Invalidation: daily close back above $768 (EMA21/SMA50D cluster). (45% probability)
- Scenario 2: Neutral Range Chop — Price bounces from the lower Bollinger Band and oscillates inside the $740-$785 range, with the moving averages near $765 acting as a ceiling. Trigger: stabilization above $750 with RSI holding above 35-40 and CMF staying near 0. Target: $750-$770. Invalidation: close above $785 or below $735. (27% probability)
- Scenario 3: Bullish Mean-Reversion Rebound — The close outside the lower band proves to be a one-day flush, and buyers defend the long-term uptrend. Price reclaims the EMA21 and revisits the range highs. Trigger: close above $768 on volume. Target: $783-$795. Invalidation: close below $745. (28% probability)
PRICE TARGETS
- Target Price: $745.00 (48-day horizon, about 1.4% below the current price)
- Expected Range: $692.00 to $790.00 (width $98, about 13% of the current price, consistent with the 30-60 day guidance of 12-18%)
- Key Levels: Support at $740.00, Resistance at $767.68
OVERALL BIAS
OVERALL BIAS: BEARISH - The high-volume breakdown below EMA21, EMA55 and SMA50D, the fresh bearish MACD cross, and −DI (37.1) far above +DI (18.0) favor a drift toward the lower range and the 200-day SMA. The intact long-term uptrend above the SMA200D and weak ADX limit conviction and cap the downside.
This is educational analysis and not financial advice.