XLF 48-day bullish forecast — Nov 1, 2026
- Bias: Bullish
- Timeframe: 48 days (made Nov 1, 2026, target date Dec 18, 2026)
- Price at analysis: $56.51
- Price target: $58.00
- Expected range: $53.80 – $61.20
- Result: Pending — graded after the close on Dec 18, 2026
Get a free AI analysis of XLF today
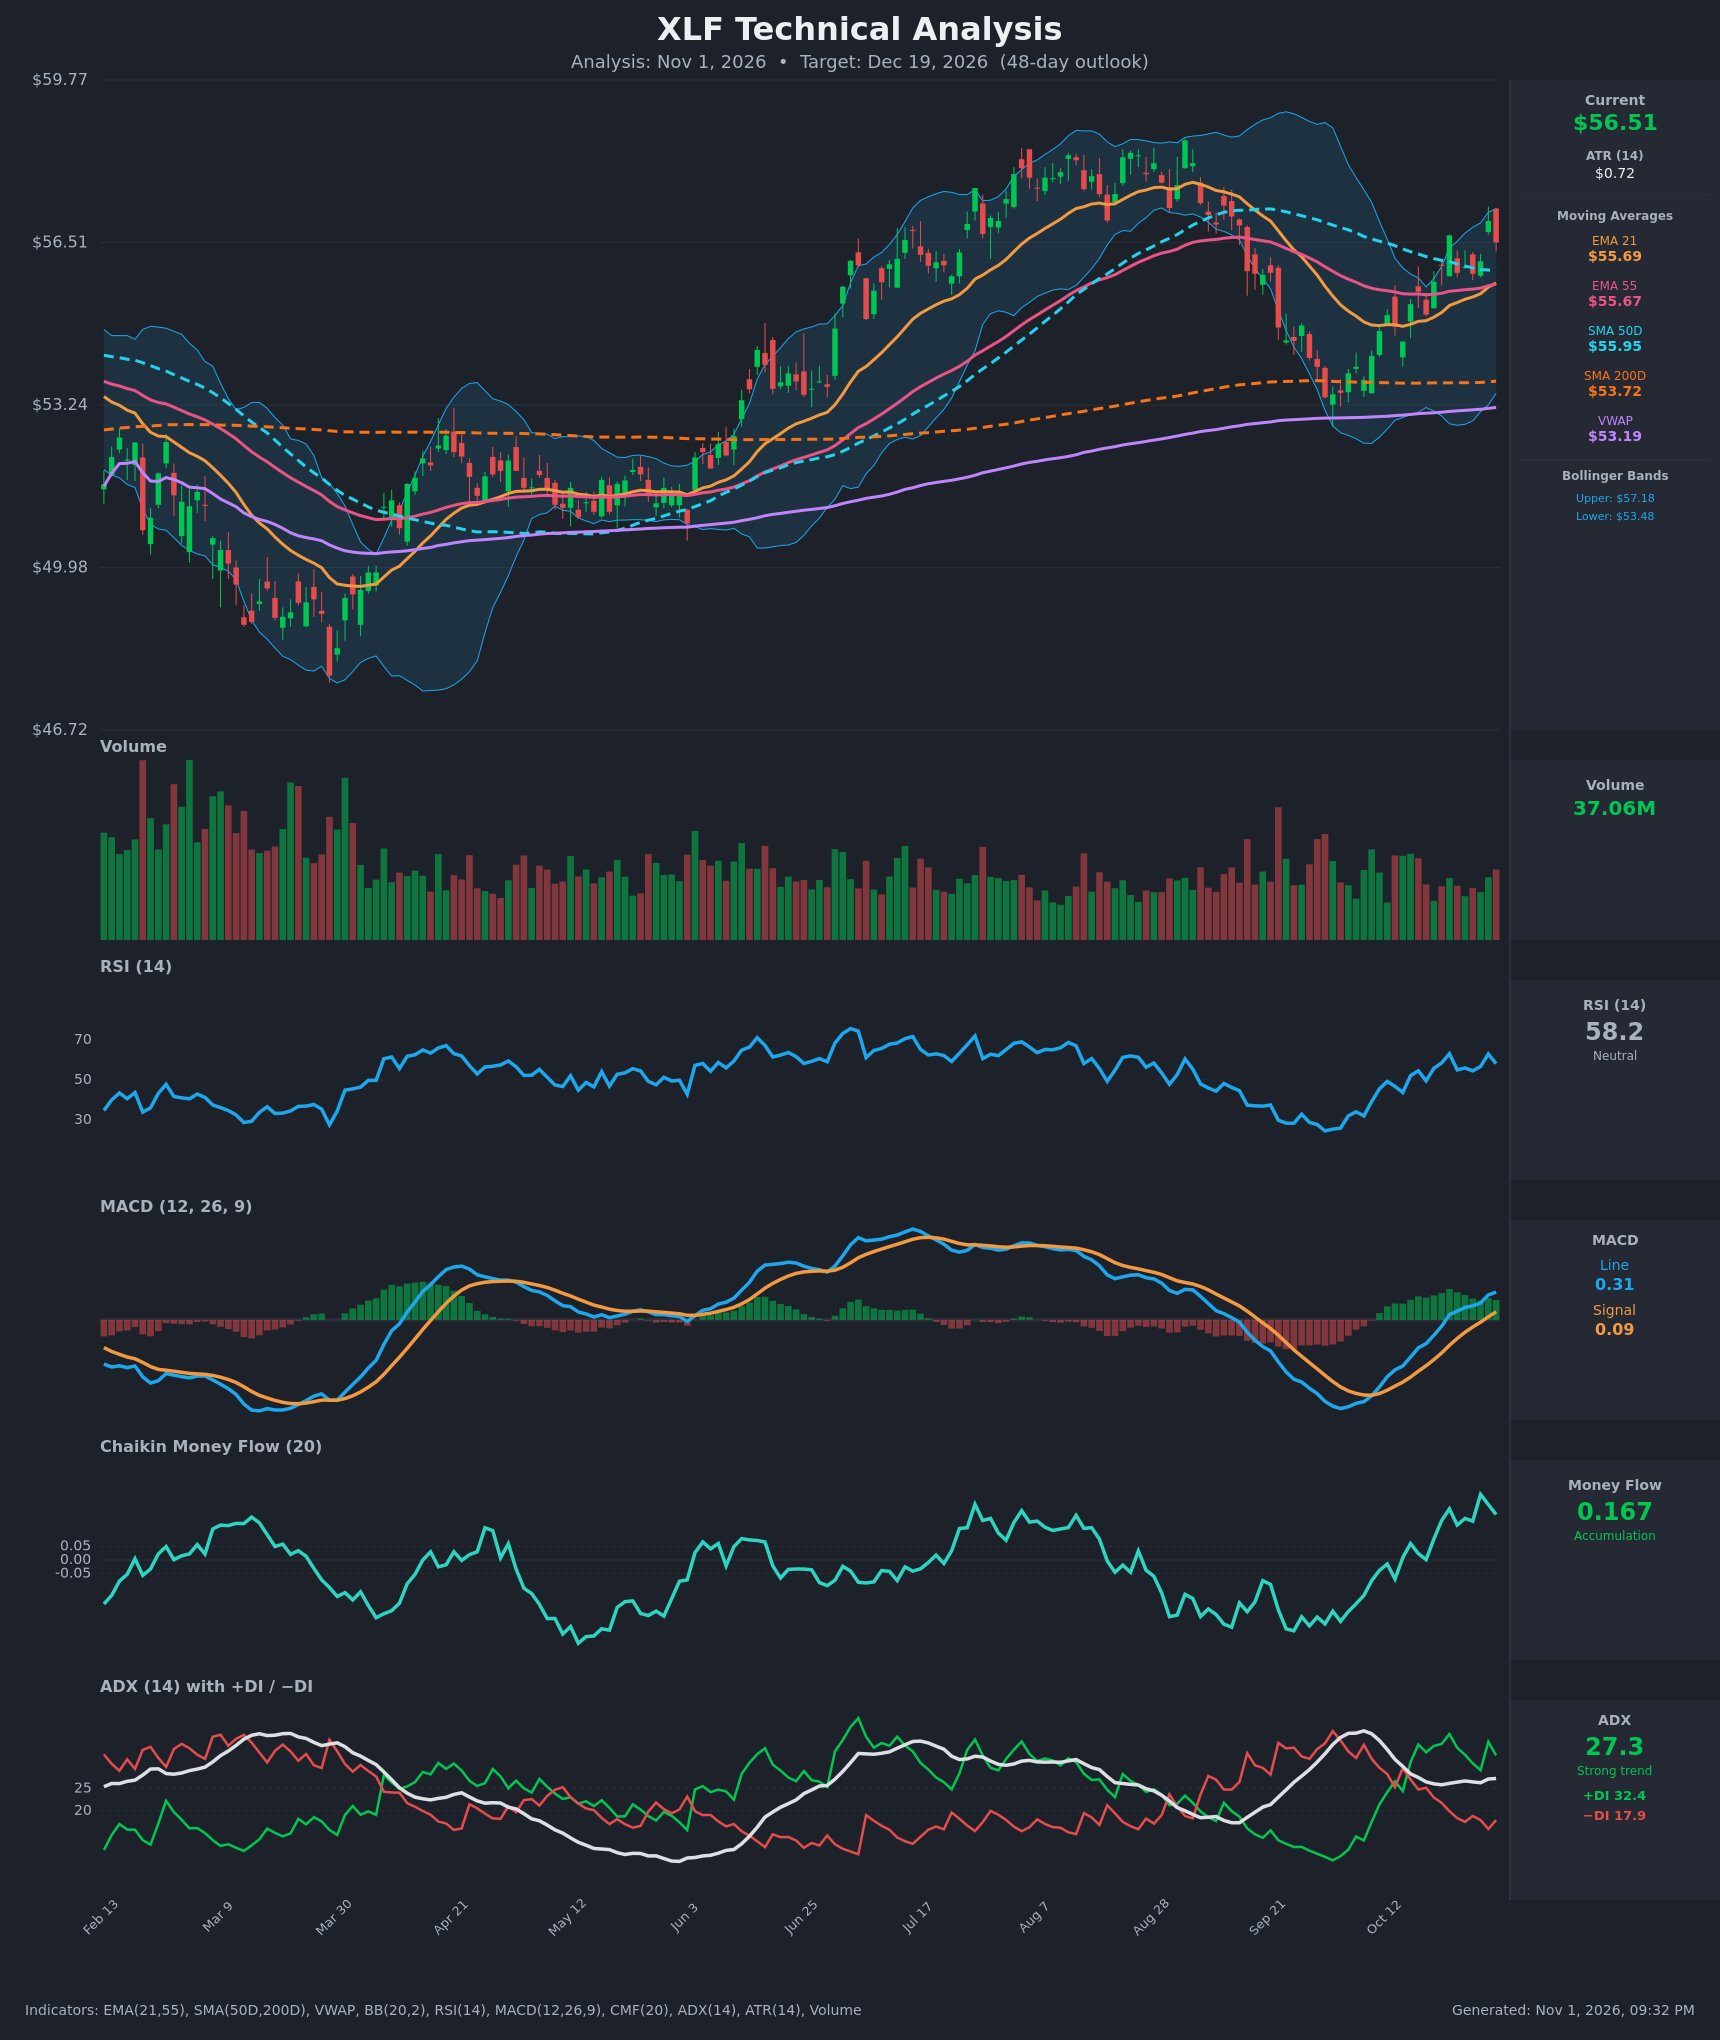
Analysis
TECHNICAL INDICATORS
- RSI (14): 58.19, recovering from the ~30 oversold zone in late September and holding in the 55-63 band over the past two weeks. It is not overbought, so there is room to run. [Bullish]
- 20 EMA (EMA 21): $55.69, with price at $56.51 about 1.5% above it. EMA21 has just crossed above EMA55 ($55.67), which is a fresh bullish crossover, and the rising EMA21 now acts as dynamic support. [Bullish]
- MACD: Line 0.306 is above Signal 0.088, a bullish crossover on Oct 22-29 that is now widening. The histogram is positive and rising, and the line has turned up from deeply negative territory. [Bullish]
- Bollinger Bands (20): Upper $57.18, lower $53.48, so price at $56.51 sits in the upper third of the bands (~82% of the band width). The bands are starting to expand off a tight squeeze. There is limited room to the upper band, which implies short-term resistance at ~$57.18, but a walk along the upper band is possible in a strong trend. [Bullish]
- CMF (20): 0.167 is well above +0.05, and it has been positive for most of the last 10 bars (peak 0.241). That shows sustained accumulation. [Accumulation]
- ADX (14): 27.3 with +DI 32.4 over −DI 17.9. The trend is strong and bulls are in control. ADX has stabilized at 26-27 after falling from 33.8, while the DI spread has widened. [Strong Trend – Bullish]
- Volume: 37.06M, roughly average to slightly below the heavy selling volume seen in Sept. Recent up days show decent participation, while the latest pullback bar came on modest volume. There is no distribution signature. [Neutral to mildly Bullish]
Other trend context: price is above SMA200D ($53.72) and VWAP ($53.19), which signals a long-term uptrend. SMA50D ($55.95) is now just below price. Price reclaimed it and is trying to hold it. SMA50D is above SMA200D, so there is no death cross and the golden cross structure remains intact.
DIVERGENCES & TRENDS
- There is no meaningful bearish divergence. RSI (58) is below its Oct 22 and Oct 29 peaks (~63), while price on Oct 30 is below the Oct 29 high ($56.94). This is a minor, normal pullback rather than a divergence.
- The MACD bullish crossover came from below zero and has now crossed the zero line, which is a stronger confirmation.
- The EMA21/EMA55 bullish cross on Oct 30 follows a corrective decline from the late-August high (~$58.5) to the ~$53.3 low around late September/early October. The sequence of higher lows since the bottom is constructive.
- CMF has trended from negative (Sept) to a strong positive reading of 0.167, which leads price higher.
- +DI crossed above −DI on Oct 15, and the gap has widened since.
- Overhead resistance: SMA50D at $55.95 has flattened and is declining toward price, and the prior high near $58.5 caps the larger structure.
CHART PATTERNS
- Bullish Double Bottom / Rounded Base: The late-September low near $53.3 held above the rising SMA200D (~$53.7). The subsequent higher low and recovery resembles a double bottom against the early-October base. The neckline sits near the $56.9-57.2 area. A decisive close above it targets the prior high zone near $58.5, and possibly $59 on a measured move.
- Bullish Flag / Pennant (minor): The recent tight consolidation between $55-56.9 after the sharp recovery leg is consistent with a continuation pause. A breakout above $57 would aim toward $58.5-59.
- There is a risk of a lower-high structure versus the August peak. If $57.2 rejects price repeatedly, a range between $54.5 and $57.2 would persist, but momentum favors the upside.
POTENTIAL SCENARIOS
- Scenario 1: Bullish Breakout Continuation — Price pushes through Bollinger upper band and the $57.2 neckline, supported by CMF accumulation and a strong ADX with +DI dominance. Trigger: daily close above $57.20 on above-average volume. Target: $58.50-$59.00 by mid-December. Invalidation: close below $55.00 (below EMA21/EMA55/SMA50D cluster). (55% probability)
- Scenario 2: Neutral Range Consolidation — Price stalls beneath $57.2 resistance and oscillates around the 21/55 EMA confluence at $55.7 and SMA50D at $55.95. Trigger: repeated rejections at $57.0-57.2 with RSI sliding back to ~50. Target: $55.00-$57.20 range. Invalidation: close above $57.5 or below $54.5. (28% probability)
- Scenario 3: Bearish Failed Rally — Price fails at the August downtrend resistance, MACD rolls over, and price loses the EMA cluster, heading back toward the SMA200D. Trigger: daily close below $55.00 with rising volume. Target: $53.70-$54.00 (SMA200D), with a deeper test of $53.30. Invalidation: reclaim of $56.00. (17% probability)
PRICE TARGETS
For the 48-day horizon (target date Dec 19, 2026), the formula for a 30-60 day timeframe suggests a range width of ~12-18% of the current price. Self-check: Expected Range $52.60 to $60.70... narrowed to $53.60 to $61.00? Let me finalize: Expected Range $53.80 to $61.20 gives a width of $7.40, which is 13.1% of $56.51, within the 12-18% guidance and wider than any 2-14 day range.
- Target Price: $58.00 (for the 48-day timeframe, ~+2.6% from current)
- Expected Range: $53.80 to $61.20 (width $7.40 ≈ 13.1%)
- Key Levels: Support at $55.69 (EMA21, with a deeper floor at $53.72, the SMA200D), Resistance at $57.18 (upper Bollinger Band / neckline, then ~$58.50)
OVERALL BIAS
OVERALL BIAS: BULLISH - Fresh EMA21/55 and MACD bullish crossovers, strong ADX with +DI dominance, CMF accumulation at 0.167, and price above both SMA200D and VWAP favor a push toward $58 over the 48-day window, though the upper Bollinger Band at $57.18 and SMA50D could cause near-term chop.
This is educational analysis and not financial advice.