AAL 62-day bullish forecast — Nov 1, 2026
- Bias: Bullish
- Timeframe: 62 days (made Nov 1, 2026, target date Jan 1, 2027)
- Price at analysis: $12.60
- Price target: $13.30
- Expected range: $11.20 – $14.60
- Result: Pending — graded after the close on Jan 1, 2027
Get a free AI analysis of AAL today
Analysis
TECHNICAL INDICATORS
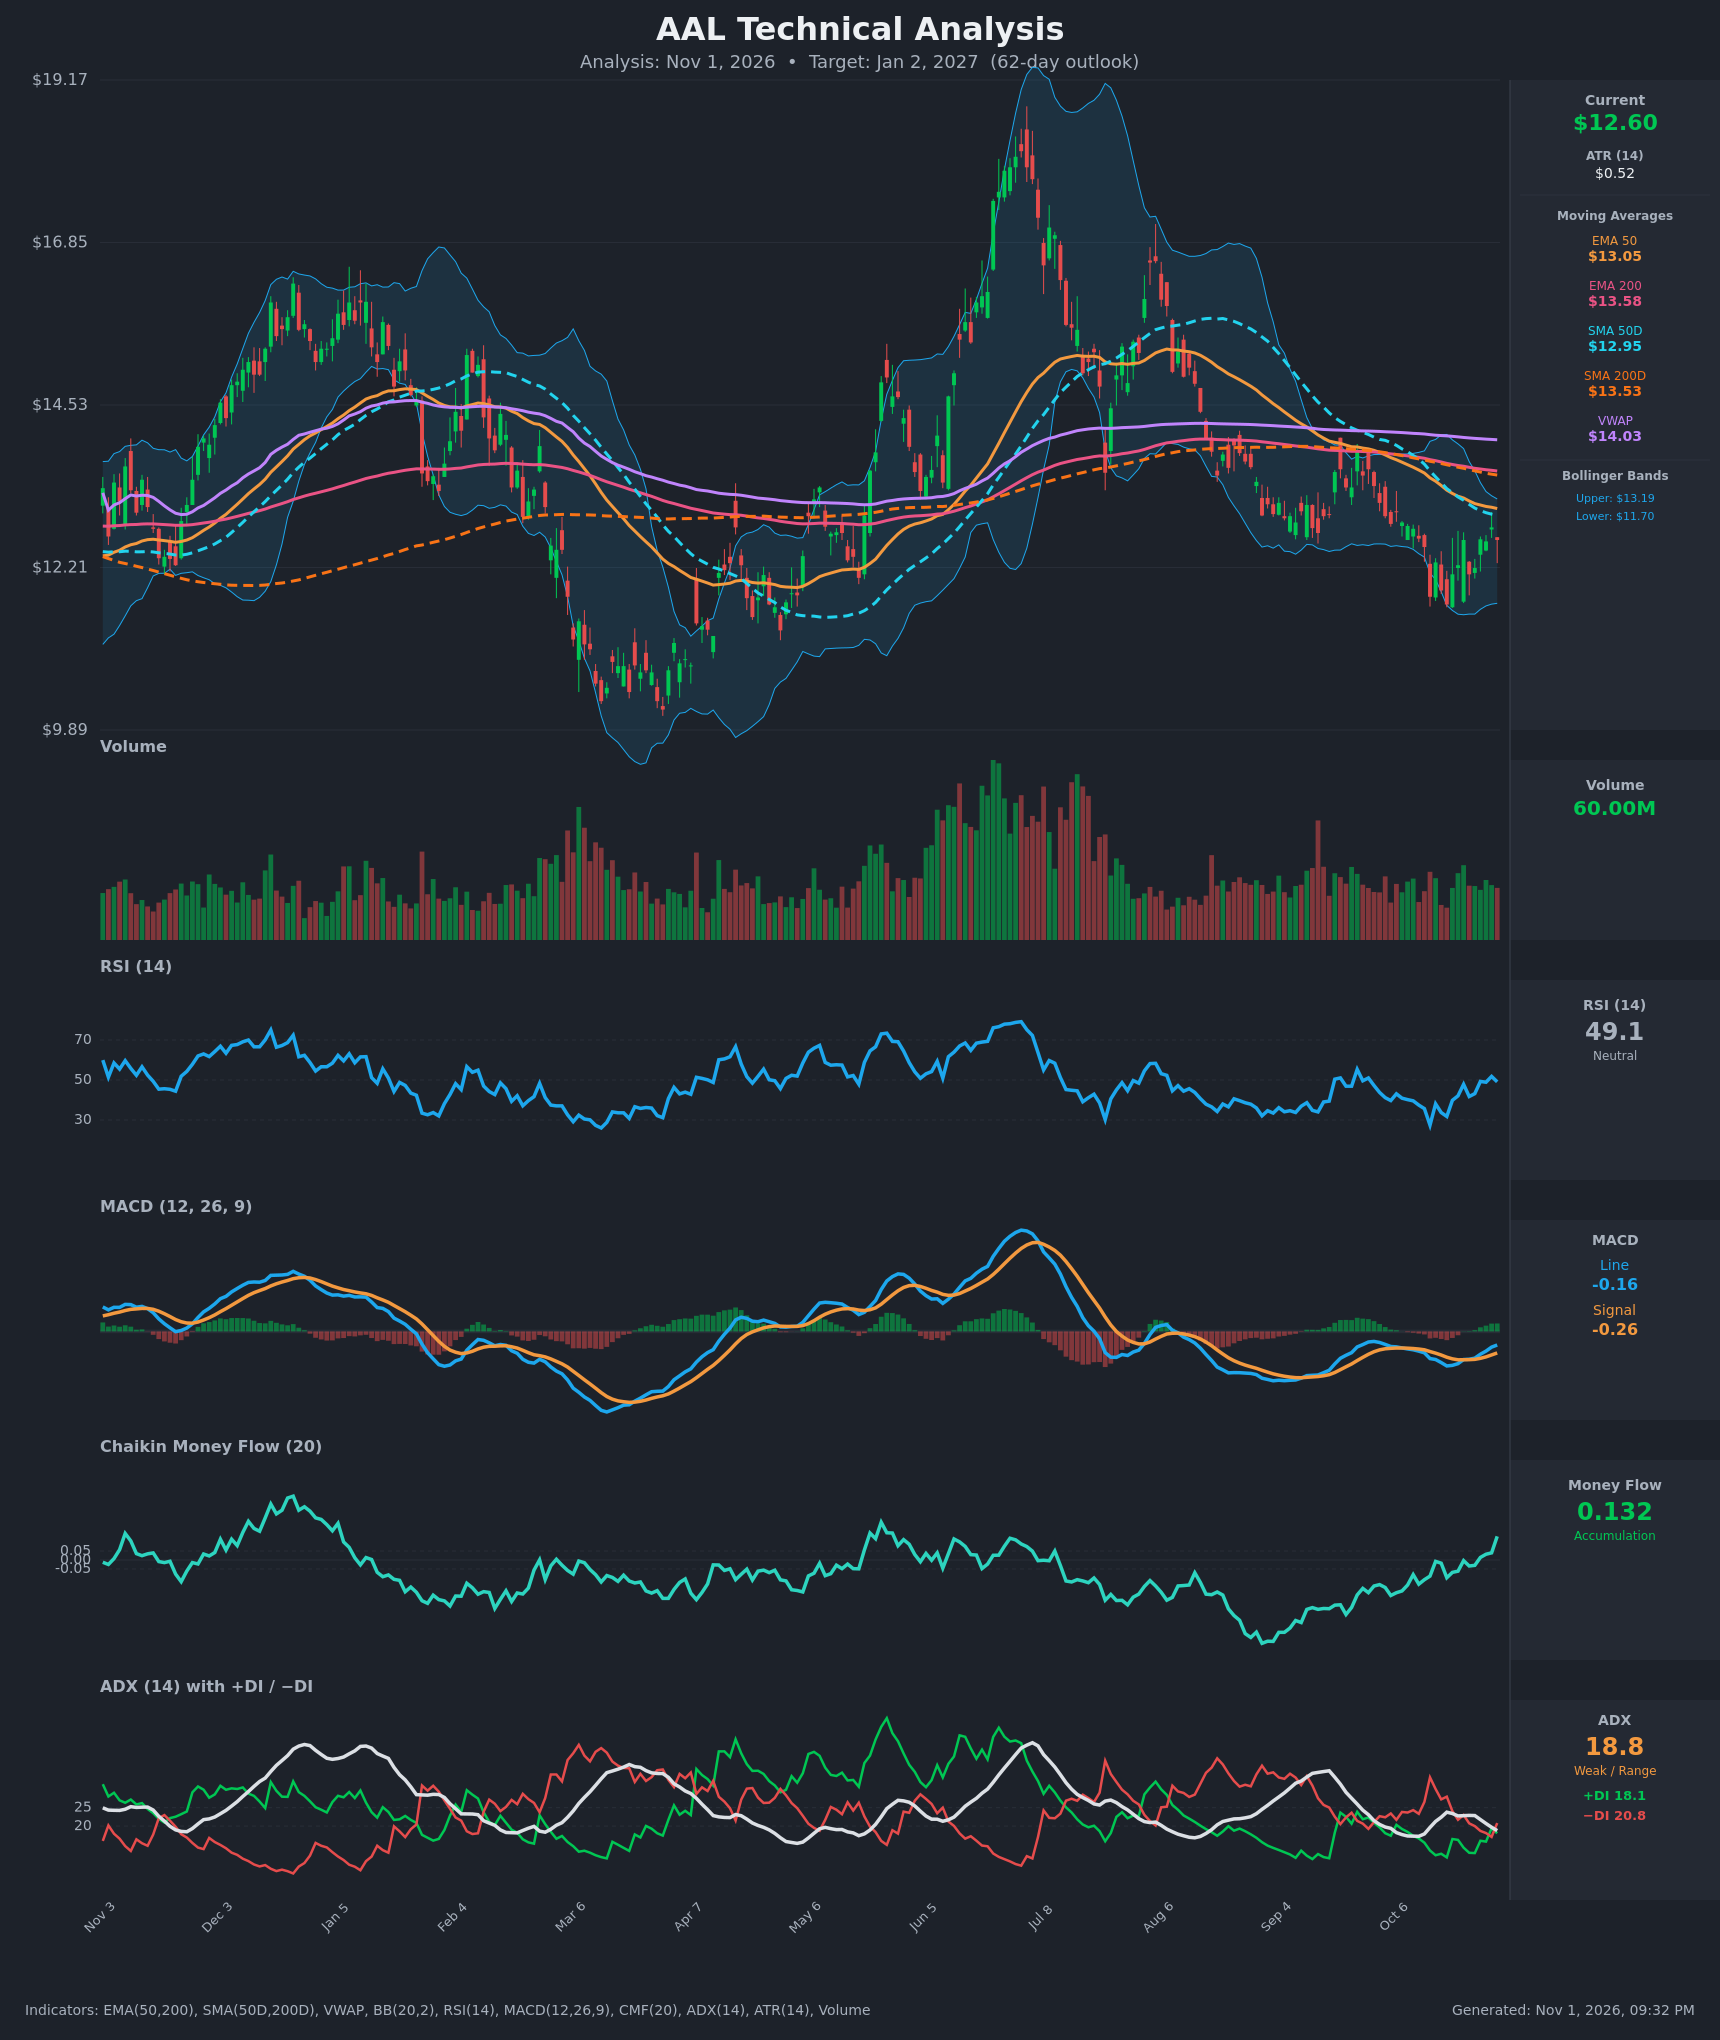
- RSI (14): 49.08, neutral. It has recovered sharply from oversold at 27.4 on Oct 14 and is now back at the midline, so downside momentum has been fully reset. [Neutral]
- 20 EMA: The 20 EMA is not given. The Bollinger midline (20-period basis) is about $12.44, and price at $12.60 sits just above it, which is mild short-term support. Price remains below EMA50 ($13.05), EMA200 ($13.58), SMA50D ($12.95), SMA200D ($13.53) and VWAP ($14.03), all of which act as overhead resistance. [Neutral]
- MACD: The line (-0.164) crossed above the signal (-0.260) around Oct 22. The histogram is positive (+0.096) and widening, but both lines are still below zero. This is an early momentum recovery, not yet a trend change. [Bullish]
- Bollinger Bands (20): Upper $13.19, lower $11.70, midline about $12.44. Price is in the upper half of the bands after bouncing from the lower band. The bands have narrowed from the prior sell-off, which points to contained volatility. [Neutral]
- CMF (20): 0.132, rising from -0.135 on Oct 12 and above +0.05. Buying pressure has stepped in near the $11.7–12.0 lows, which is a constructive sign. [Accumulation]
- ADX (14): 18.8, below 20 and falling from 23.8. −DI (20.8) is only slightly above +DI (18.1), and the gap has narrowed sharply from 33 vs 13 on Oct 14. The sell-off trend has lost strength and the market is range-bound with a slight bearish lean. [Weak Trend, marginally bearish but fading]
- Volume: 60.00M, roughly average. Recent up days carry slightly heavier green volume than the capitulation bars of mid-October, and there is no sign of fresh panic selling. [Neutral-to-mildly bullish]
DIVERGENCES & TRENDS
- Bullish divergence: Price made its low on Oct 14–19 ($11.68–$11.79), while RSI (27 → 32) and CMF (-0.09 → +0.13) have since recovered strongly and MACD has crossed up. Momentum and money flow are improving faster than price.
- Long-term trend is still down: Price is below the SMA200D (13.53), EMA200 (13.58) and VWAP (14.03). SMA50D (12.95) is below SMA200D, and EMA50 (13.05) is below EMA200. That is a bearish moving-average structure, though the gaps are narrowing.
- Crossovers: There is a MACD bullish crossover. The +DI/−DI gap is closing, and a +DI cross above −DI would confirm the shift. SMA50D is turning down more slowly and is about to be reclaimed by price (12.95 vs 12.60).
- Contrast: The long-term trend is bearish, but short-term momentum and money flow are bullish, so conviction is modest.
CHART PATTERNS
- Bullish Double Bottom (developing): Lows near $11.68 (Oct 19) and $11.79 (Oct 14) are followed by a rebound toward $12.60–12.78. The neckline is around $12.8–13.0, close to EMA50/SMA50D. A close above $13.2 would confirm it, with a measured target near $13.9–14.2 (neckline plus the roughly $1.1–1.2 pattern height).
- Range structure: The larger picture since Aug is a lower-high sequence, from about $15.5 to $13.8 to the current $12.6. That keeps bearish continuation possible if $11.68 fails. Resistance is stacked at $13.05–13.58, which will slow any rally.
POTENTIAL SCENARIOS
- Scenario 1: Bullish Double-Bottom Recovery — Accumulation and the MACD upturn carry price through the $13.05–13.19 cluster and toward the long-term averages. Trigger: daily close above $13.20 with +DI crossing above −DI. Target: $13.60–14.00 (EMA200/SMA200D, then VWAP). Invalidation: close below $11.68. (45% probability)
- Scenario 2: Neutral Range Chop — Price oscillates between $11.80 and $13.20 with ADX below 20 and reclaims no resistance. Trigger: repeated rejections at the 13.05–13.58 MA cluster and holds above 11.7. Target: $12.30–13.00. Invalidation: close outside $11.60–$13.60. (25% probability)
- Scenario 3: Bearish Trend Resumption — Rejection at the declining EMA50/EMA200 resumes the lower-high, lower-low trend. Trigger: close below $12.10, then the $11.68 low. Target: $10.80–11.20. Invalidation: close above $13.20. (30% probability)
PRICE TARGETS
- Target Price: $13.30 (62-day horizon, Jan 2, 2027)
- Expected Range: $11.20 to $14.60 (width $3.40, about 27% of the current price, consistent with the 61–180 day guidance)
- Key Levels: Support at $11.68, Resistance at $13.05
OVERALL BIAS
OVERALL BIAS: BULLISH - A bullish MACD crossover, strongly rising CMF (+0.132) and RSI recovery from oversold suggest a developing double bottom above $11.68. Price is likely to mean-revert toward the $13.0–13.6 moving-average cluster, though the long-term bearish MA structure and the overhead resistance keep conviction modest.
This is educational analysis and not financial advice.