AAPL 62-day bullish forecast — Nov 1, 2026
- Bias: Bullish
- Timeframe: 62 days (made Nov 1, 2026, target date Jan 1, 2027)
- Price at analysis: $344.63
- Price target: $357.00
- Expected range: $315.00 – $380.00
- Result: Pending — graded after the close on Jan 1, 2027
Get a free AI analysis of AAPL today
Analysis
TECHNICAL INDICATORS
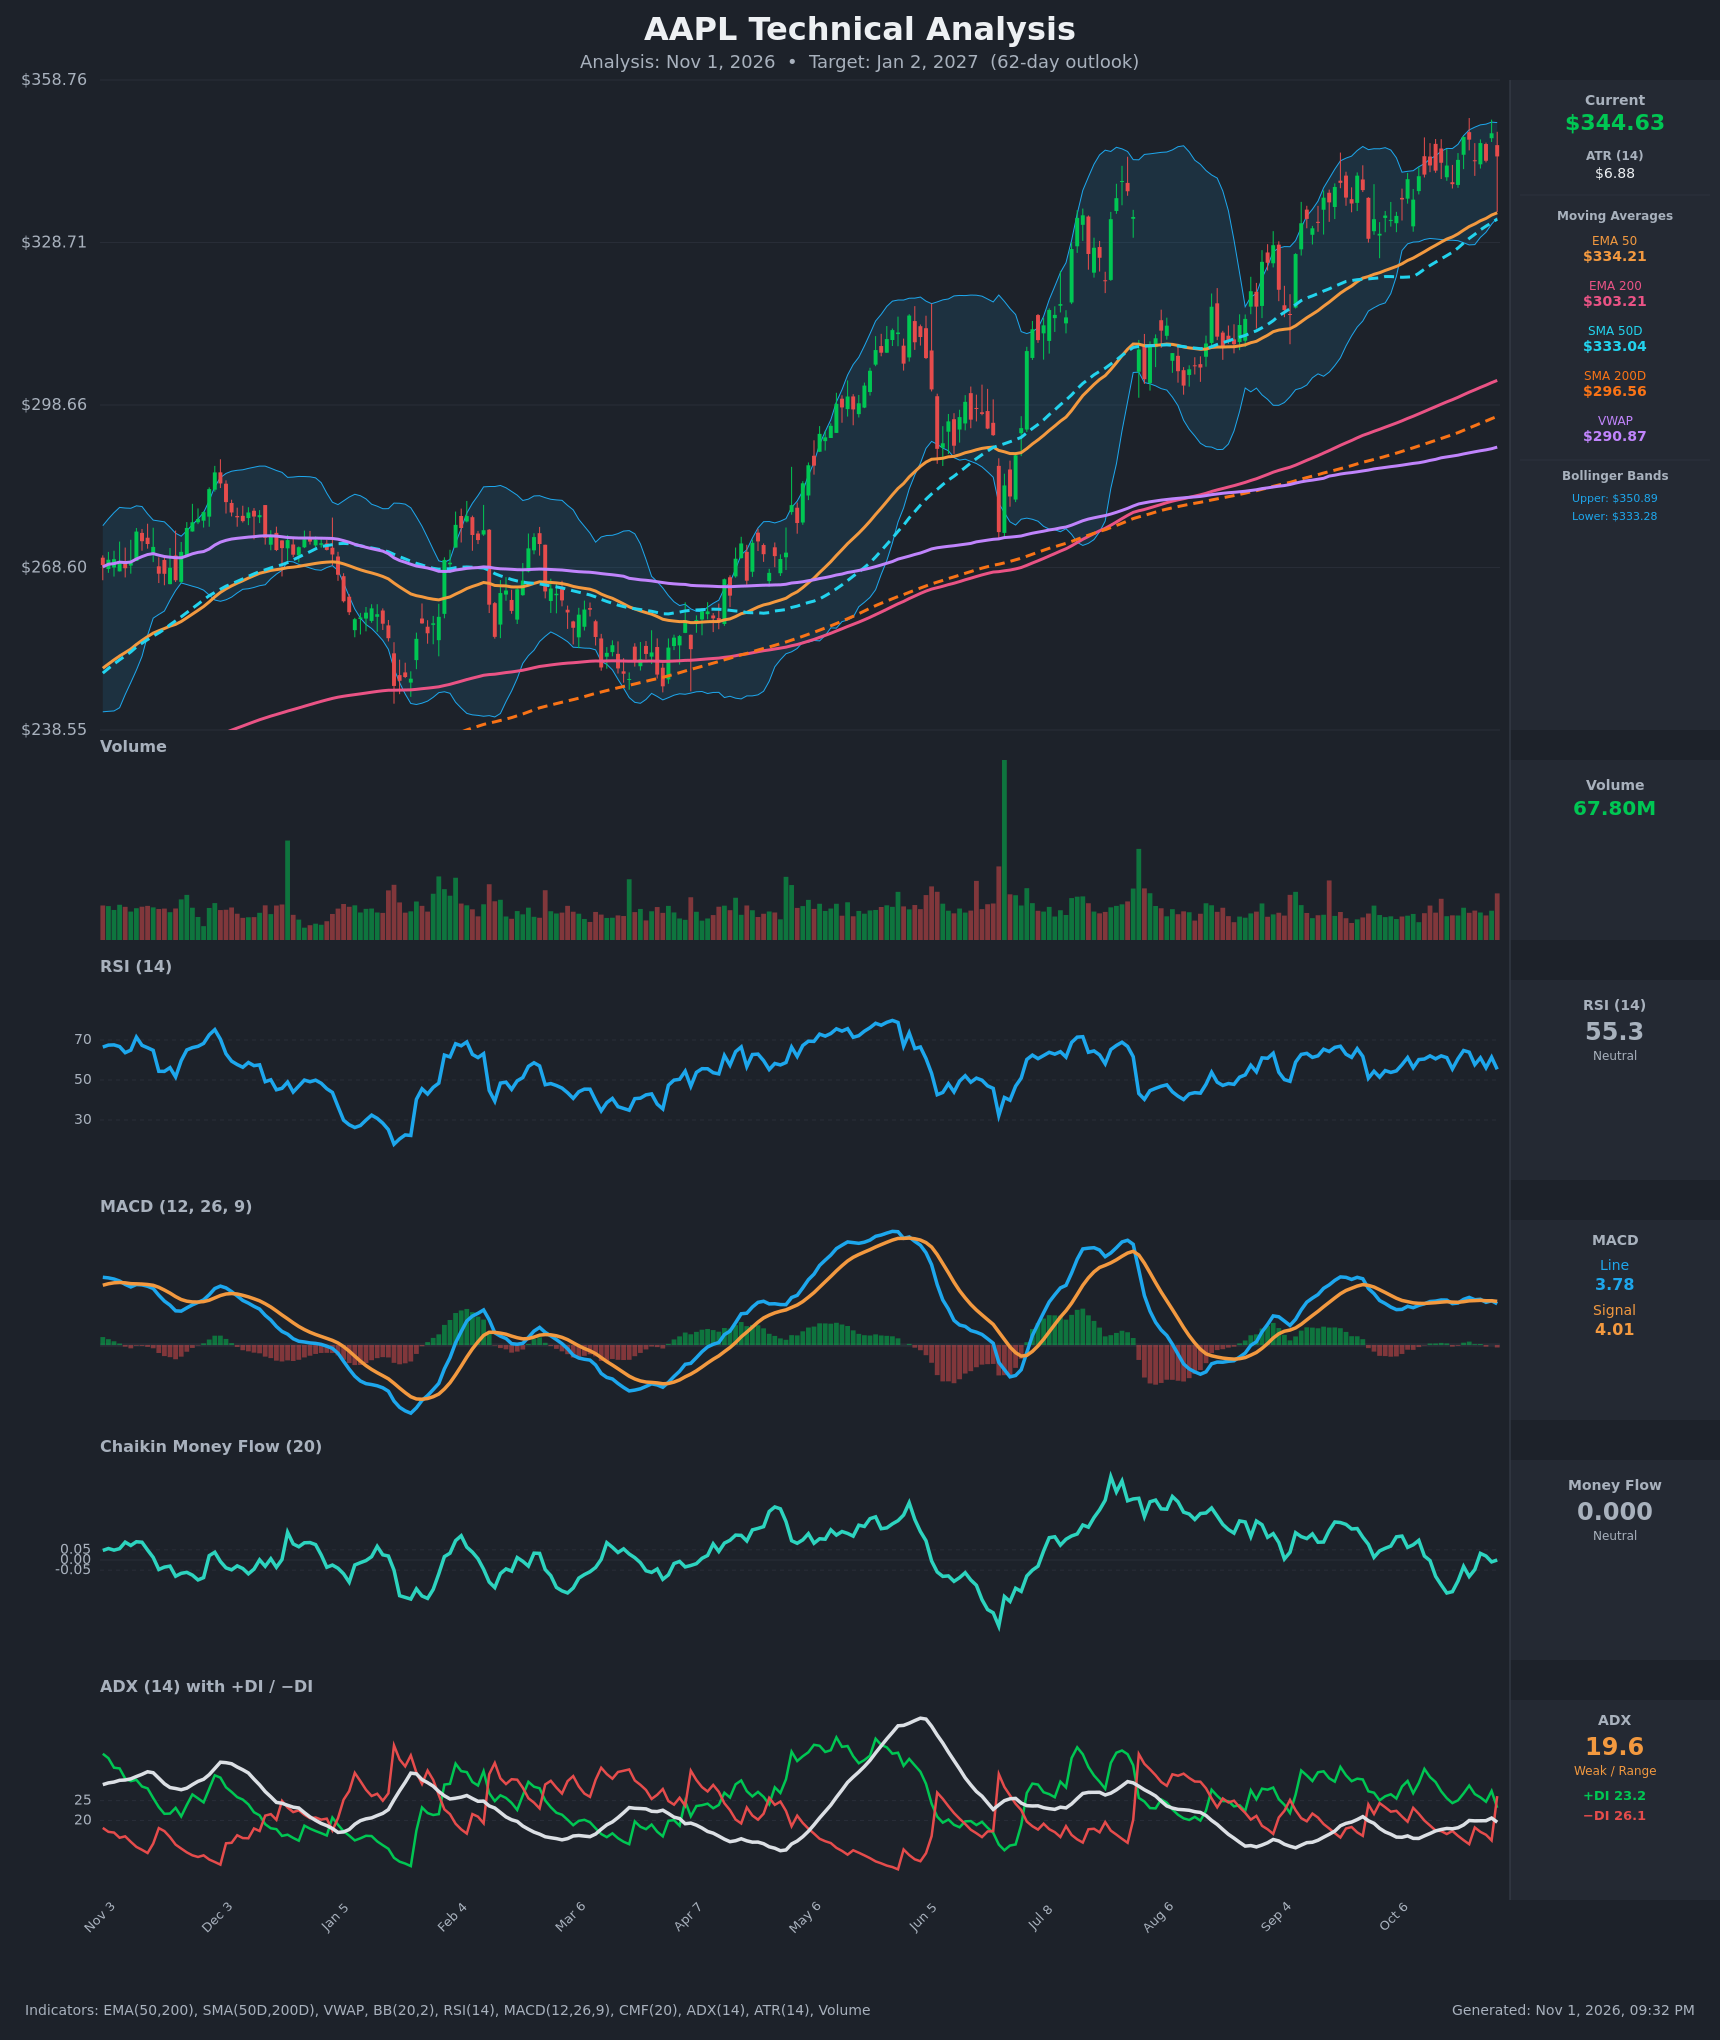
- RSI (14): 55.35, down from 64.8 on Oct 22 and sitting mid-range. It has repeatedly bounced between 55 and 65 over the past month without reaching overbought. Momentum is flat to slightly fading. [Neutral]
- 20 EMA: No 20 EMA value was supplied. The 50 EMA at $334.21 and SMA50D at $333.04 sit about 3% below price and have been rising steadily. The Bollinger midline (about $342) is the practical 20-period proxy, and price is just above it. [Bullish]
- MACD: Line 3.78 is below Signal 4.01, a mild bearish crossover as of Oct 30 (the Oct 29 reading was line 4.06 vs signal 4.06). Both lines are positive but flat for about 6 weeks, and the histogram is slightly negative. This shows stalling momentum, not a reversal. [Bearish]
- Bollinger Bands (20): Upper $350.89, lower $333.28, so price at $344.63 is in the upper half. Bandwidth is moderate and the bands are tilting up. Price keeps getting rejected near the upper band (about $348-349) and pulls back toward the midline. [Neutral]
- CMF (20): 0.000, inside the ±0.05 neutral zone. It slid from +0.097 on Oct 12 to a low near -0.16 and has recovered to flat. The weak money flow is a caution, but selling pressure is not intensifying. [Neutral]
- ADX (14): 19.6 is below 20, so the trend is weak or range-bound. −DI (26.1) just crossed above +DI (23.2) after the Oct 30 drop. That is a short-term bearish tilt, but it is not backed by trend strength. [Weak Trend, slight bearish DI tilt]
- Volume: 67.80M, a bit above the recent average, on a red candle that fell from $348.91 to $344.63. This is mild distribution on the pullback and not a capitulation. [Mildly bearish]
DIVERGENCES & TRENDS
- Price vs. MACD/RSI: Price made higher highs ($348.22 → $348.91) while MACD peaked near 4.37 on Oct 23 and has since flattened. This is a mild bearish divergence in momentum and signals consolidation, not a trend break.
- Moving average structure: The stack is fully bullish. Price ($344.63) is above EMA50 ($334.21), SMA50D ($333.04), EMA200 ($303.21), SMA200D ($296.56) and VWAP ($290.87). The golden cross is long established (SMA50D is 12% above SMA200D), and all averages are rising. Price is also stretched about 16% above the SMA200D.
- Trend: Since the April low the chart shows a clear sequence of higher highs and higher lows. Dips to the 50-day averages have been bought each time (Jun, Aug, Sep).
- Crossovers: Both the −DI over +DI cross and the MACD cross below signal are fresh and shallow, with ADX under 20. Treat them as warnings of consolidation, not confirmed sell signals.
CHART PATTERNS
- Bullish Flag / Ascending Triangle (continuation): Price has been consolidating between roughly $339 and $349 after the strong September-October advance. The higher lows along the rising 50-day averages and the flat resistance near $349 resemble an ascending triangle. A close above $349-351 would target a measured move of about $360-365.
- Bearish Rising Wedge (reversal risk): The advance since August has been tightening along the upper band while momentum flattens. This is a possible rising wedge. A close below $333 (lower band and SMA50D) would confirm it and open a move toward $315, near the prior breakout zone.
- Assessment: The continuation read is slightly favored because the trend, MA stack and rising supports are intact. The pattern is not yet decisive.
POTENTIAL SCENARIOS
- Scenario 1: Bullish Breakout Continuation — Price holds the 50-day averages, MACD re-crosses up, and price breaks the $349-351 resistance zone, resuming the uptrend. Trigger: daily close above $351 on rising volume. Target: $360-$370. Invalidation: close below $333. (50% probability)
- Scenario 2: Bearish Pullback to the Rising Averages — Weak ADX, the −DI cross, negative MACD and an extended price (16% above the SMA200D) drive a deeper correction. Trigger: daily close below $333 (BB lower and SMA50D). Target: $315-$320, with an extreme test of $303 (EMA200). Invalidation: reclaim of $350. (30% probability)
- Scenario 3: Neutral Range Chop — Price stays pinned between $333 and $350 with ADX below 20 and CMF near zero. Trigger: failure of both breakout and breakdown levels. Target: $338-$348. Invalidation: close outside $333-$351. (20% probability)
PRICE TARGETS
- Target Price: $357.00 (62-day, about +3.6%)
- Expected Range: $315.00 to $380.00 (width $65 ≈ 18.9% of current price, consistent with the 61-180 day guidance)
- Key Levels: Support at $333.00 (SMA50D / Bollinger lower band / EMA50 at about $334), Resistance at $349.00 (recent swing high, just under the $350.89 upper band)
OVERALL BIAS
OVERALL BIAS: BULLISH - The long-term structure is firmly bullish (price above all key averages, golden cross intact, higher highs and higher lows), and the 62-day horizon favors trend continuation. Near-term caution is warranted by the negative MACD cross, −DI over +DI and neutral CMF, so conviction is modest and a break below $333 would challenge the thesis.
This is educational analysis and not financial advice.