AMZN 62-day bearish forecast — Nov 1, 2026
- Bias: Bearish
- Timeframe: 62 days (made Nov 1, 2026, target date Jan 1, 2027)
- Price at analysis: $240.35
- Price target: $232.00
- Expected range: $208.00 – $266.00
- Result: Pending — graded after the close on Jan 1, 2027
Get a free AI analysis of AMZN today
Analysis
TECHNICAL INDICATORS
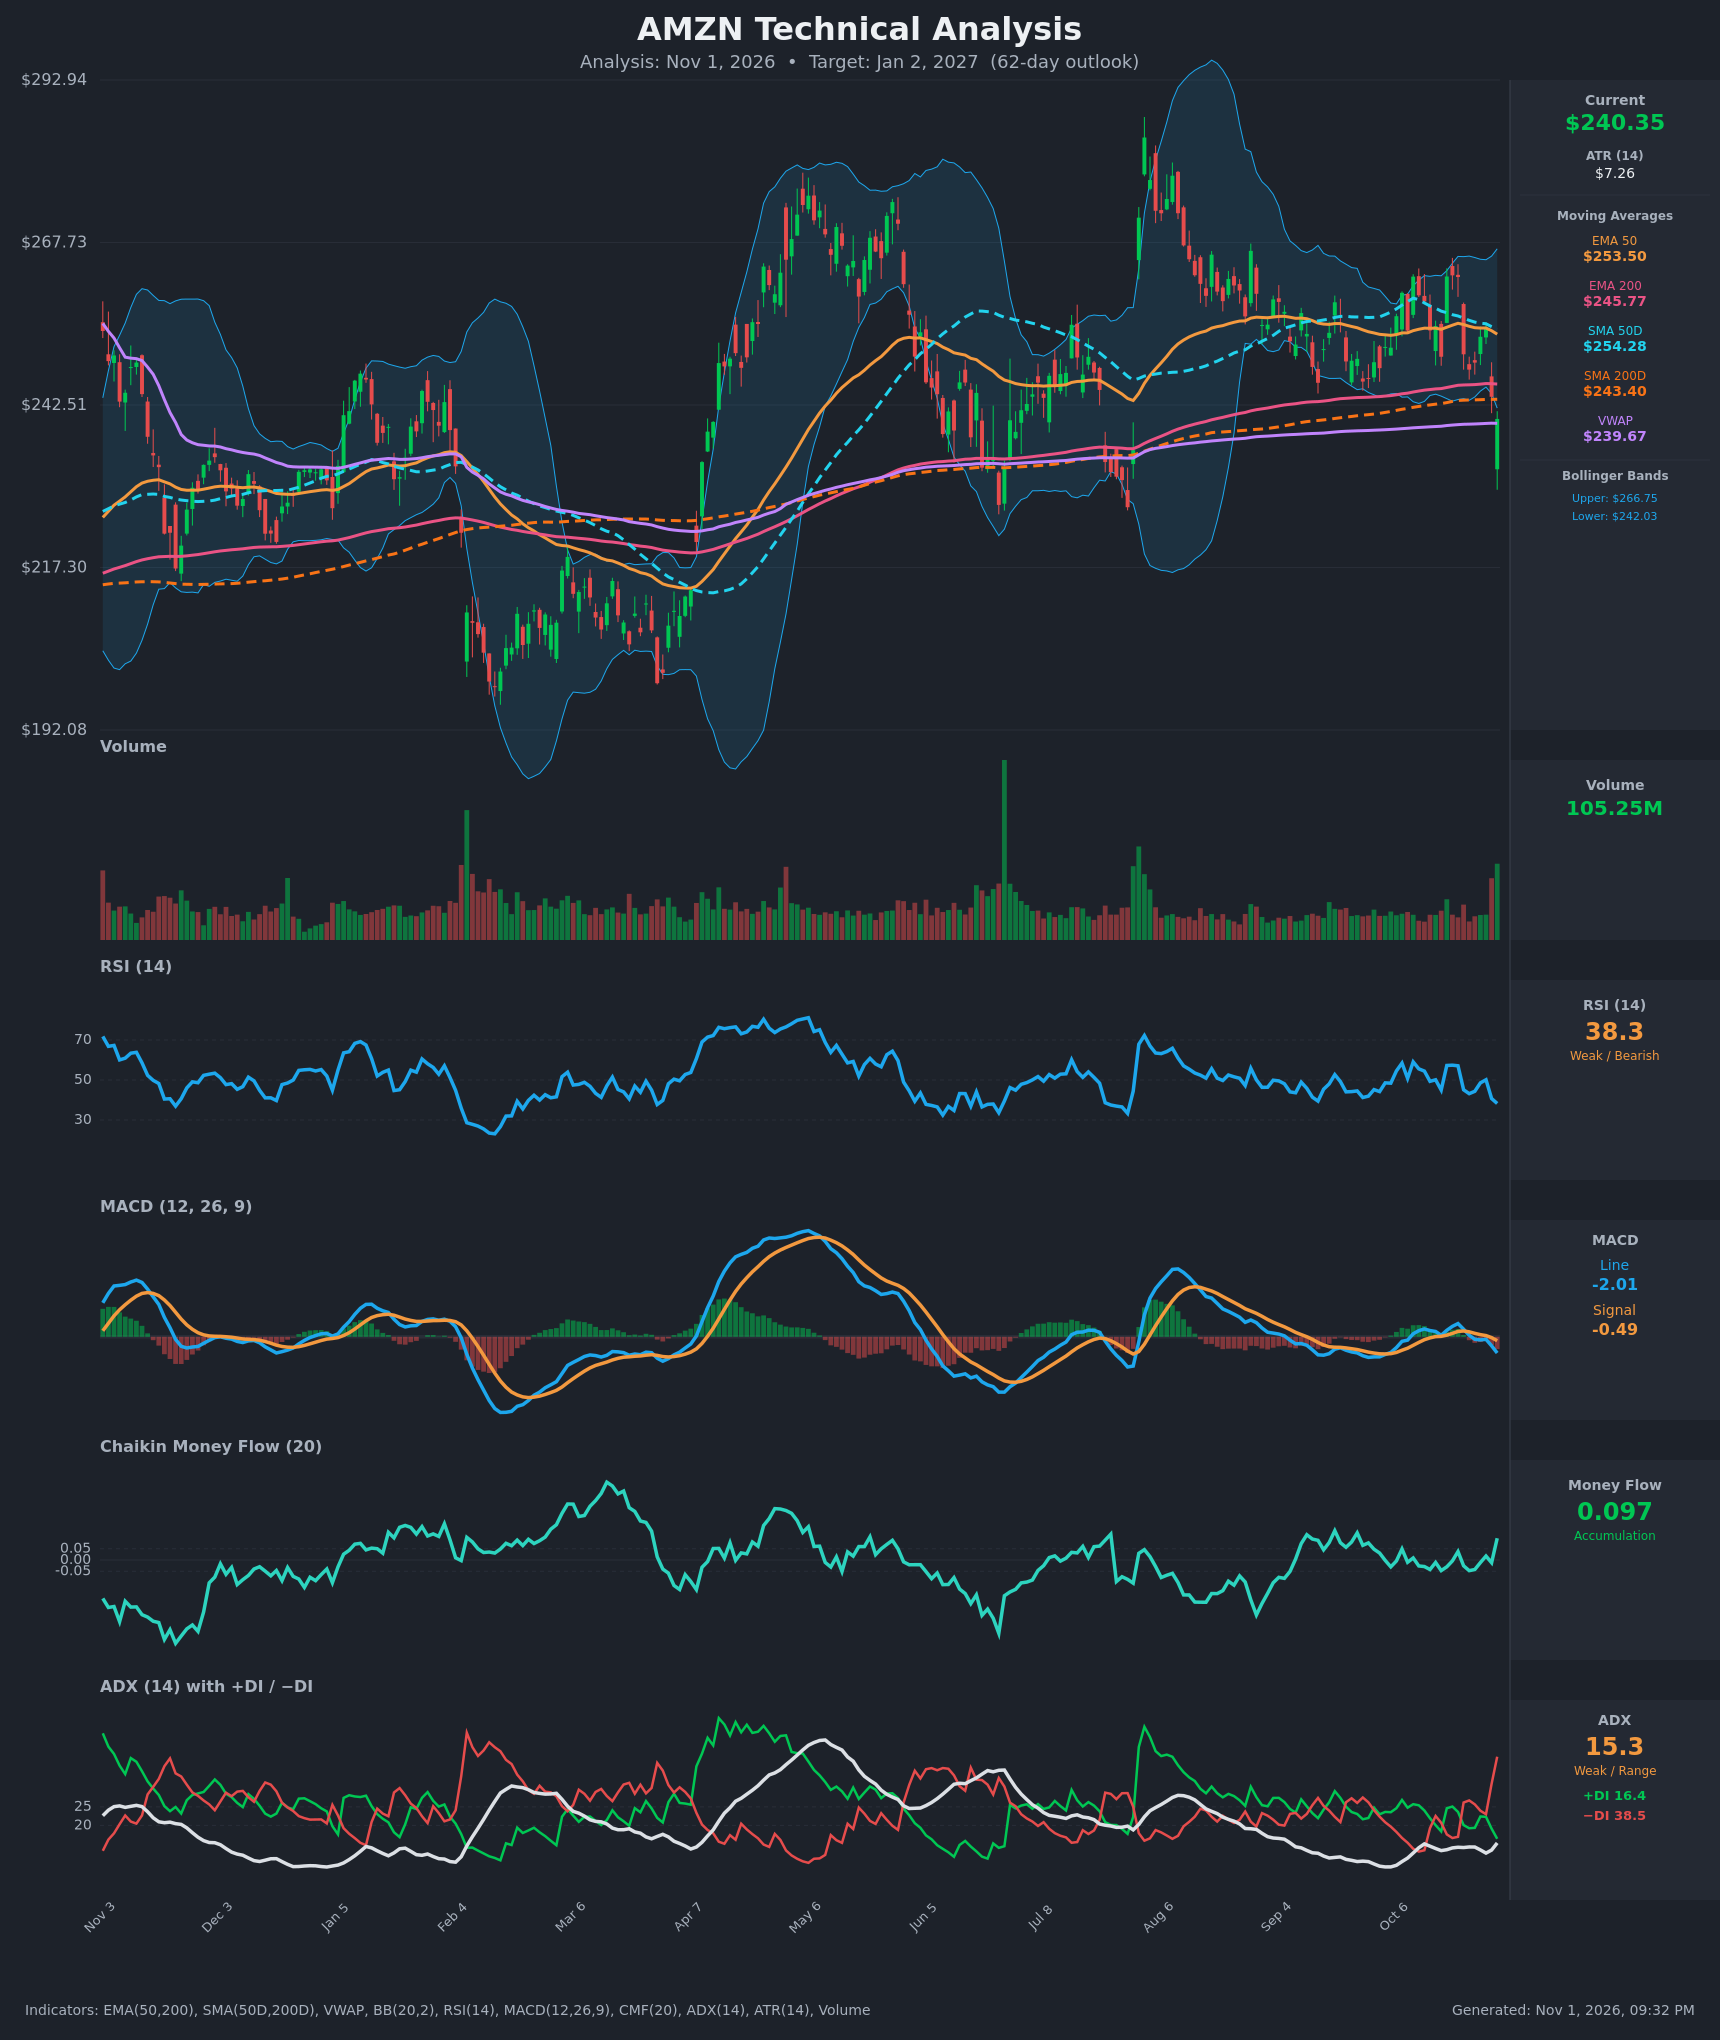
- RSI (14): 38.3, down from 57 on Oct 21 and 50 on Oct 28. It is approaching the oversold zone (30) but is not there yet. Momentum is clearly deteriorating. [Bearish]
- 20 EMA: The 20 EMA isn't supplied. The EMA 50 ($253.50) is a proxy and is sloping down slightly. Price at $240.35 is about 5% below it, so it is now overhead resistance. [Bearish]
- MACD: Line -2.01 is below signal -0.49 after a bearish crossover around Oct 28-29. The histogram has turned negative and is widening, and the line is now at its lowest level in the recent window. [Bearish]
- Bollinger Bands (20): Upper $266.75, lower $242.03. Price closed below the lower band after a sharp gap-down. This is a volatility-expansion break to the downside. It can mean-revert, but in a weak trend it often "walks" the band. [Bearish]
- CMF (20): 0.097, above the +0.05 threshold. It was hovering around zero or slightly negative for most of October and only just turned positive, partly because of the large-volume final bar. This is a mild contradiction to the price action and the one real bullish offset. [Accumulation]
- ADX (14): 15.3 (weak trend), but −DI 38.5 is far above +DI 16.4, and −DI has risen from 13 to 38.5 in two weeks. The trend is not yet established, but sellers are in clear control, and ADX is turning up from its low. [Weak Trend, Bearish Direction]
- Volume: 105.25M, the largest bar in months, on a heavy red/gap-down candle. High-volume selling confirms the breakdown rather than a drift lower. [Bearish – high-volume breakdown]
Other levels:
- Price is below the EMA 50 ($253.50), SMA 50 ($254.28), EMA 200 ($245.77) and SMA 200 ($243.40). The chart shows a death-cross-like compression, with the 50s rolling over toward the 200s.
- Price is only marginally above VWAP ($239.67), so it is sitting on the last real support.
DIVERGENCES & TRENDS
- No clear divergence: RSI, MACD and price are all making lower lows together.
- CMF vs. price: CMF is rising (+0.097) while price drops. This is a mild bullish divergence, but it is unreliable because the single huge-volume bar drives it. It needs confirmation from the next few sessions.
- DI: −DI crossed above +DI on Oct 15 and again decisively on Oct 22. The spread (22 points) is the widest since the spring.
- MACD: The bearish crossover on Oct 29 followed a failed push above zero (peak 1.64 on Oct 21).
- Moving averages: The 50-period averages ($253.5-254.3) have been flat to lower since Aug and are converging on the 200s. The 200-day SMA at $243.40 has just been lost on a closing basis.
- Price structure: Lower highs since the Aug spike (~$285), then $262-265 in Oct. Failure at $262 on Oct 19-21 was followed by an immediate -8% drop.
CHART PATTERNS
- Descending Triangle / range breakdown (closest reference): Lower highs since August (~$285 → $265 → $262) meet a flat support zone around $243-250 that has now broken on a gap with heavy volume. A measured move from the triangle height (~$20) points to roughly $222-225.
- Bearish Triple Top-like structure (loose): Repeated failures near $262-265 in Sep-Oct add to the bearish read.
- Counter-case: The 6-month structure is broadly a wide range ($217-$285), and a close back above $246 would turn the breakdown into a bear trap (false breakdown).
POTENTIAL SCENARIOS
- Scenario 1: Bearish Breakdown Continuation — The gap-down on heavy volume holds, price fails to reclaim the 200-day averages, and sellers press toward the Aug lows. Trigger: daily closes below $238 (VWAP/gap low). Target: $226, then $217-220. Invalidation: daily close above $246 (EMA 200). (50% probability)
- Scenario 2: Neutral Oversold Bounce and Range — Price mean-reverts from below the lower Bollinger Band, retests $243-246 resistance, and is rejected, then chops between ~$228 and ~$248. Trigger: RSI turning up from ~35 with CMF staying positive. Target: $243-248 retest, then fade. Invalidation: close above $254 or below $226. (25% probability)
- Scenario 3: Bullish Bear-Trap Reversal — The gap-down is absorbed (CMF accumulation), price reclaims the 200-day averages and the 50s, and the old range top is retested. Trigger: close above $246, then $254. Target: $262-266. Invalidation: close back below $238. (25% probability)
PRICE TARGETS
62-day horizon (to about Jan 2, 2027):
- Target Price: $232.00
- Expected Range: $208.00 to $266.00 (width $58 ≈ 24% of current price, consistent with the 61-180 day guidance)
- Key Levels: Support at $226.00 (Aug swing low, then $217.30), Resistance at $245.77 (EMA 200; SMA 200 at $243.40 just below, then $254)
OVERALL BIAS
OVERALL BIAS: BEARISH - Price has broken below all four major moving averages and the lower Bollinger Band on its heaviest volume in months. MACD is bearish and −DI (38.5) dominates +DI (16.4). Only the CMF reading and near-oversold RSI argue for a bounce, which likely meets resistance at $243-246.
This is educational analysis and not financial advice.