AMD 62-day bearish forecast — Nov 1, 2026
- Bias: Bearish
- Timeframe: 62 days (made Nov 1, 2026, target date Jan 1, 2027)
- Price at analysis: $504.80
- Price target: $470.00
- Expected range: $405.00 – $545.00
- Result: Pending — graded after the close on Jan 1, 2027
Get a free AI analysis of AMD today
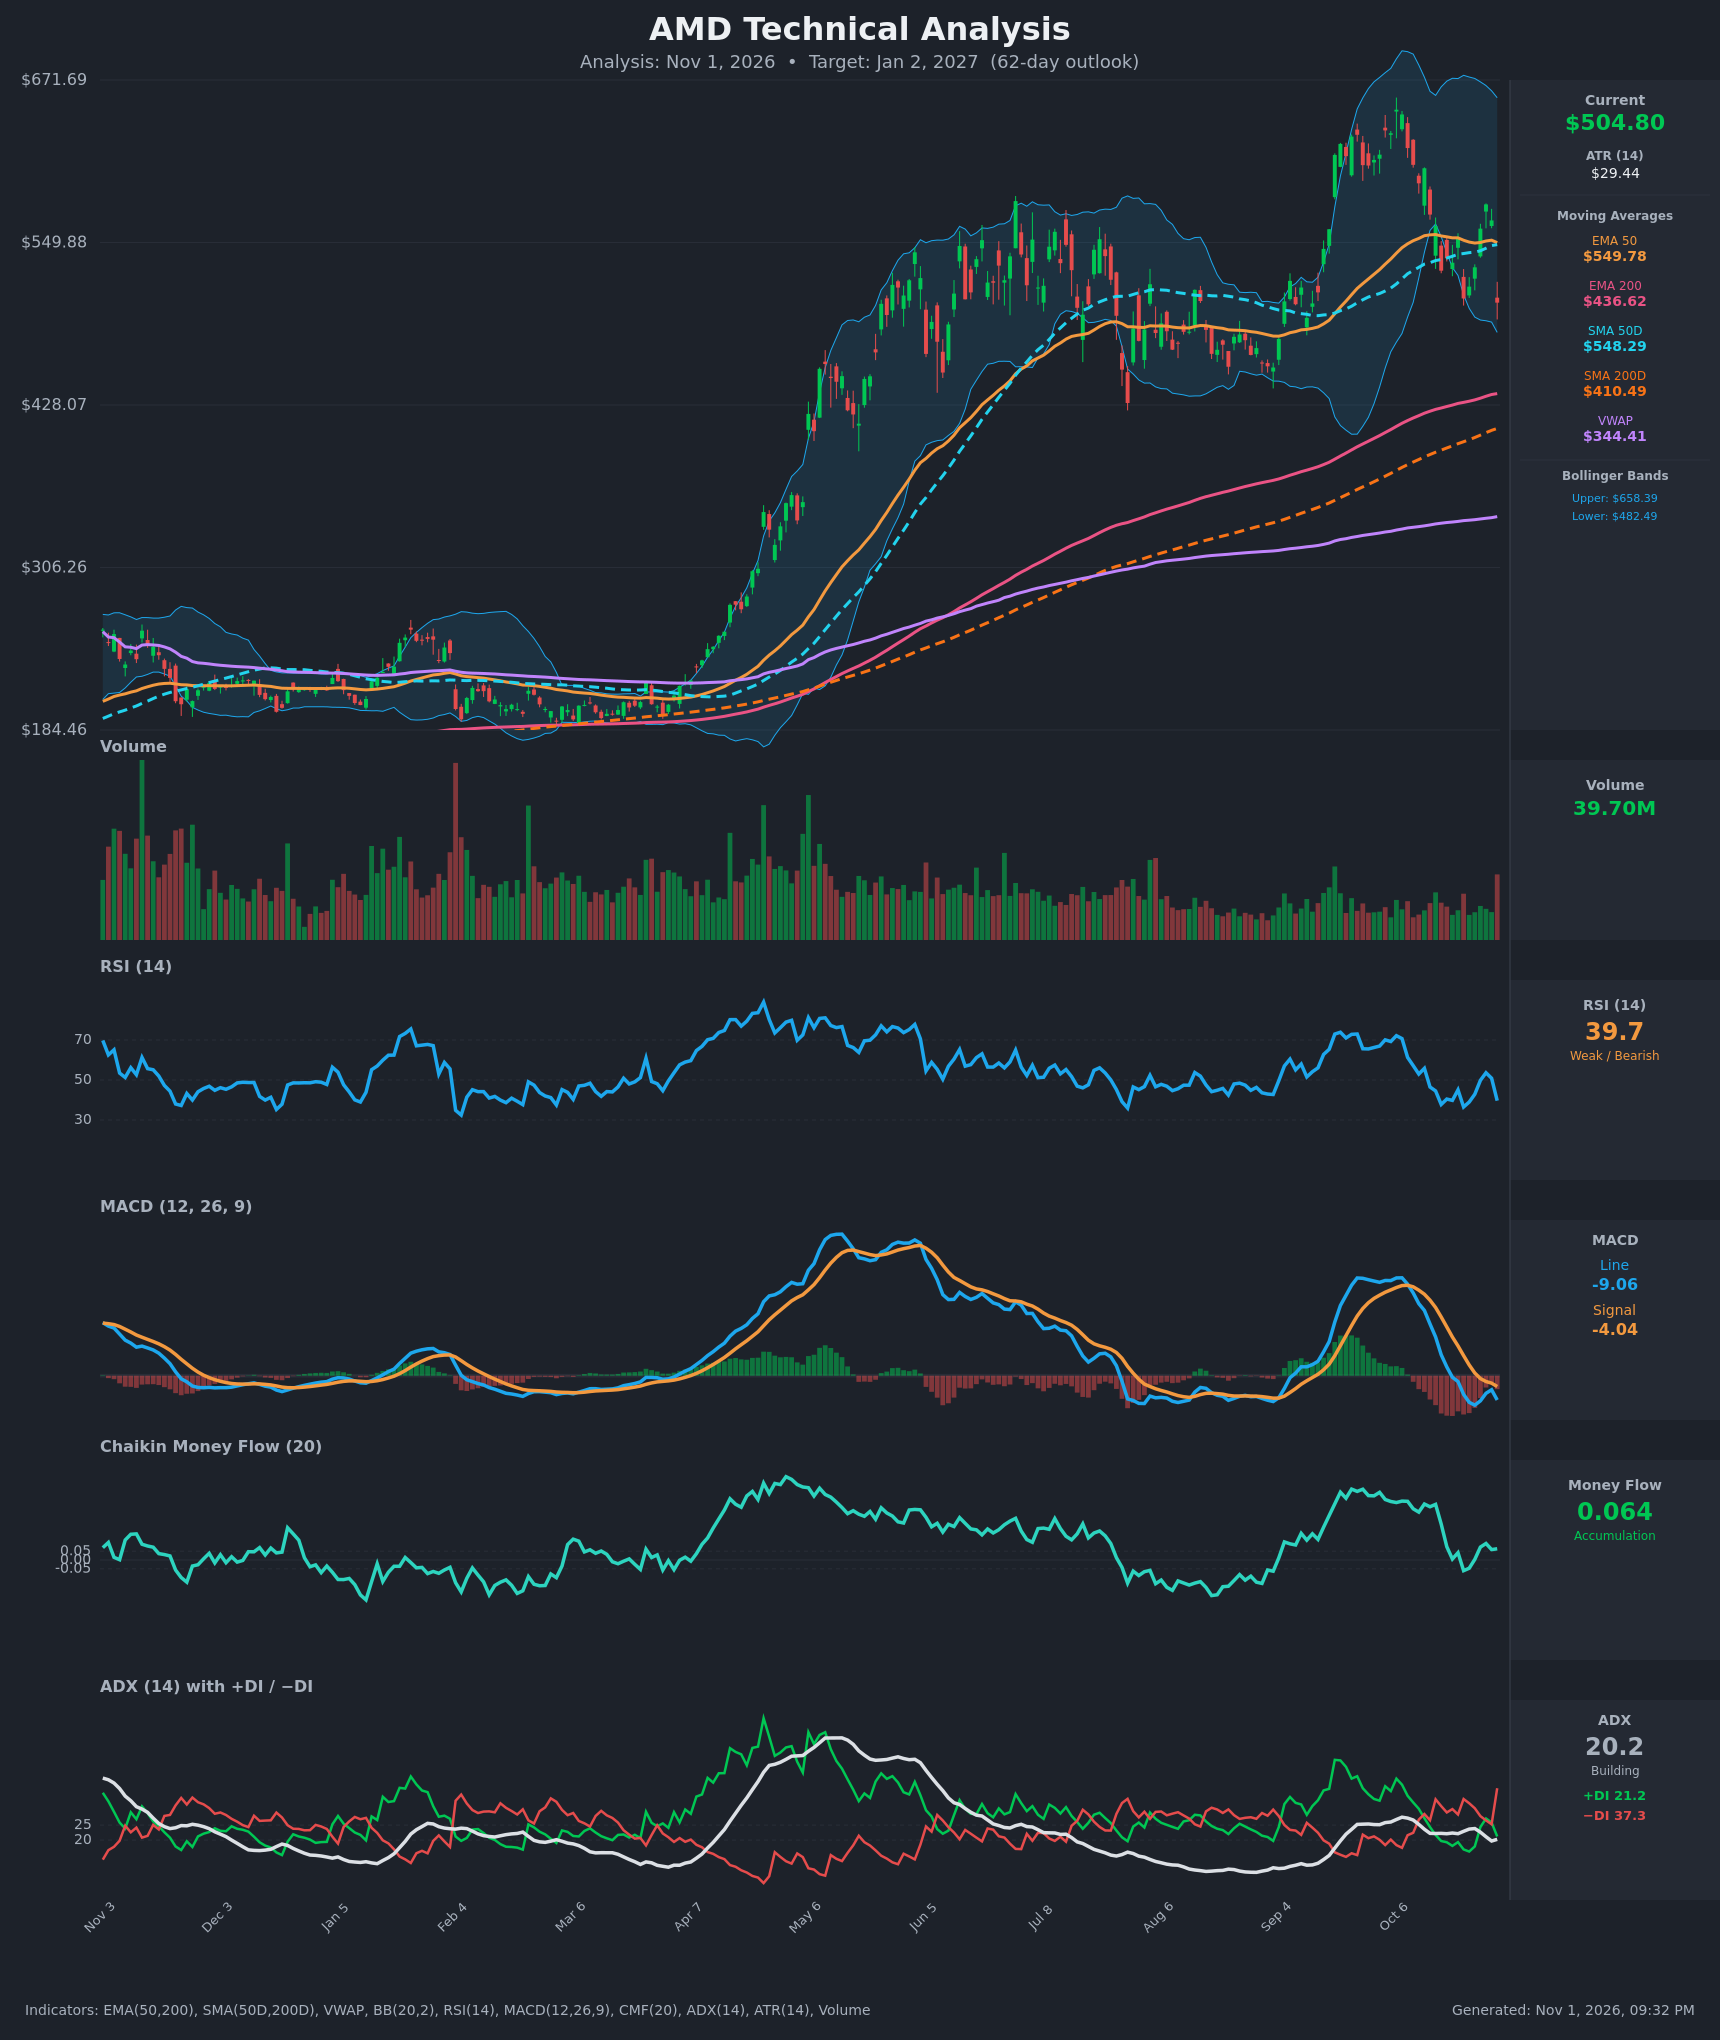
Analysis
TECHNICAL INDICATORS
- RSI (14): 39.67, down from 53.6 on Oct 28 and 50.9 on Oct 29. It sits in the weak/bearish zone below 50 but is not yet oversold (<30). Momentum is falling, and the last two swing lows (36.5 on Oct 22 and now ~39.7) show sellers repeatedly pushing it back down. [Bearish]
- 20 EMA: Not supplied. Using the EMA 50 ($549.78) and SMA 50D ($548.29) as the nearest trend proxies, price at $504.80 is about 8% below both. Both averages are now overhead resistance after a failed bounce to $578 on Oct 28. [Bearish]
- MACD: Line -9.06 is below signal -4.04, and the histogram is negative and widening. The line crossed below signal in late September and below zero on Oct 20. A brief re-test of the zero line failed, and the new down-leg is accelerating. [Bearish]
- Bollinger Bands (20): Upper $658.40, lower $482.49, so the bands are wide (about $176) after the parabolic run. Price is in the lower quarter of the band, about $22 (4.6%) above the lower band, and well under the midline. There is room for a band-walk or a tag of the lower band, and a bounce is possible given the extension. [Bearish]
- CMF (20): 0.064, marginally above the +0.05 accumulation threshold. It has fallen from 0.32 mid-October and has hovered near zero since Oct 19, so buying pressure is fading even though it still reads positive. [Neutral]
- ADX (14): 20.2 is at the weak-trend threshold, with −DI (37.3) well above +DI (21.2). −DI jumped from 25.3 to 37.3 in one session, so bears control direction even though trend strength is not yet confirmed (<25). A rising ADX from here would confirm a developing downtrend. [Weak Trend, Bearish direction]
- Volume: 39.70M, with the Oct 30 volume spike on a roughly -10.9% red candle (from $566.42 to $504.80). Volume was otherwise subdued during the Aug–Oct rebound, so the heavy-volume down day suggests distribution or a shock event. [Bearish]
DIVERGENCES & TRENDS
- Long-term trend intact: Price is above the EMA 200 ($436.62) and SMA 200D ($410.49). The golden cross happened long ago and the 200-day averages are still rising. The primary trend is up, but it is overextended and correcting.
- Short-term trend broken: Price lost the EMA 50/SMA 50D (~$549) and made a lower high ($605 → $578 bounce). Price is now below its Oct 22 low close ($507.93).
- Bearish momentum shift: MACD crossed down and is accelerating negative, RSI keeps making lower highs (55.8 → 53.6), and −DI is dominant.
- No bullish divergence yet: RSI (39.7) is not making a higher low versus price, since Oct 22 RSI was 36.5 at a similar price level. CMF positive is the only constructive element.
- Moving-average structure: EMA 50 (~$550) and SMA 50D (~$548) have flattened and are about to roll over. Price is well above VWAP ($344), reflecting the huge year-long advance, so a mean-reversion pull toward the 200-day averages is a risk.
CHART PATTERNS
- Bearish Double Top (reference diagram): Two peaks, one near the $650–660 area in early October and a lower one near $605 on Oct 13. The "neckline" is the $507–$530 swing-low zone, and the close at $504.80 is a marginal break of it. The measured move (peak ~$605 minus neckline ~$508 ≈ $97) points to roughly $410, near the SMA 200D. This is a fairly loose double top, so treat the target as a stretch scenario.
- Prior consolidation: Price ranged roughly $430–$550 from June to September, and the current price is back inside the upper-middle of that range. This makes $430–$440 (the EMA 200 area and the old range low) a logical magnet.
- Bearish Flag/Rising Wedge: The weak rebound from $507.93 to $578.44 and the roll over resemble a failed bounce within a larger corrective structure. This adds a mild bearish tilt.
POTENTIAL SCENARIOS
- Scenario 1: Bearish Neckline Break and Pullback to the 200-Day Zone — Price fails to reclaim the 50-day averages, loses the lower Bollinger Band, and drifts toward the EMA 200 area with −DI dominant and ADX rising above 25. Trigger: daily close below $482.49 (lower BB) on elevated volume. Target: $436–$470, with an extension to $410 (SMA 200D, double-top measured move). Invalidation: daily close above $550 (EMA/SMA 50 reclaim). (50% probability)
- Scenario 2: Bullish Oversold Rebound — The lower Bollinger Band and the old $480–$510 support hold, RSI curls up from the 30s, and CMF stays positive. Price recovers to retest the declining 50-day averages. Trigger: close above $530, then $550 with MACD histogram turning up. Target: $550–$580, with a stretch to $605. Invalidation: close below $482. (30% probability)
- Scenario 3: Neutral Range Chop — Price oscillates between ~$450 and ~$550 as ADX stays near 20 and signals remain mixed. Trigger: failure of both the $482 breakdown and the $550 breakout. Target: $490–$520. Invalidation: decisive close outside the $450–$550 range. (20% probability)
PRICE TARGETS
- Target Price: $470.00 (62-day, Jan 2, 2027 outlook)
- Expected Range: $405.00 to $545.00 (width $140 ≈ 27.7% of current price, consistent with the 18–30% guidance for 61–180 days)
- Key Levels: Support at $482.49 (lower Bollinger Band; below that $436.62 EMA 200), Resistance at $549.78 (EMA 50 / SMA 50D zone)
OVERALL BIAS
OVERALL BIAS: BEARISH - Price has broken below the 50-day averages and its recent swing low with a widening negative MACD, −DI far above +DI, a heavy-volume red candle, and RSI below 40. The long-term uptrend and a still-positive CMF limit the downside, so the expected path is a pullback toward the $436–$470 zone near the 200-day averages.
This is educational analysis and not financial advice.