CRWV 62-day bearish forecast — Nov 1, 2026
- Bias: Bearish
- Timeframe: 62 days (made Nov 1, 2026, target date Jan 1, 2027)
- Price at analysis: $54.87
- Price target: $50.50
- Expected range: $38.00 – $65.00
- Result: Pending — graded after the close on Jan 1, 2027
Get a free AI analysis of CRWV today
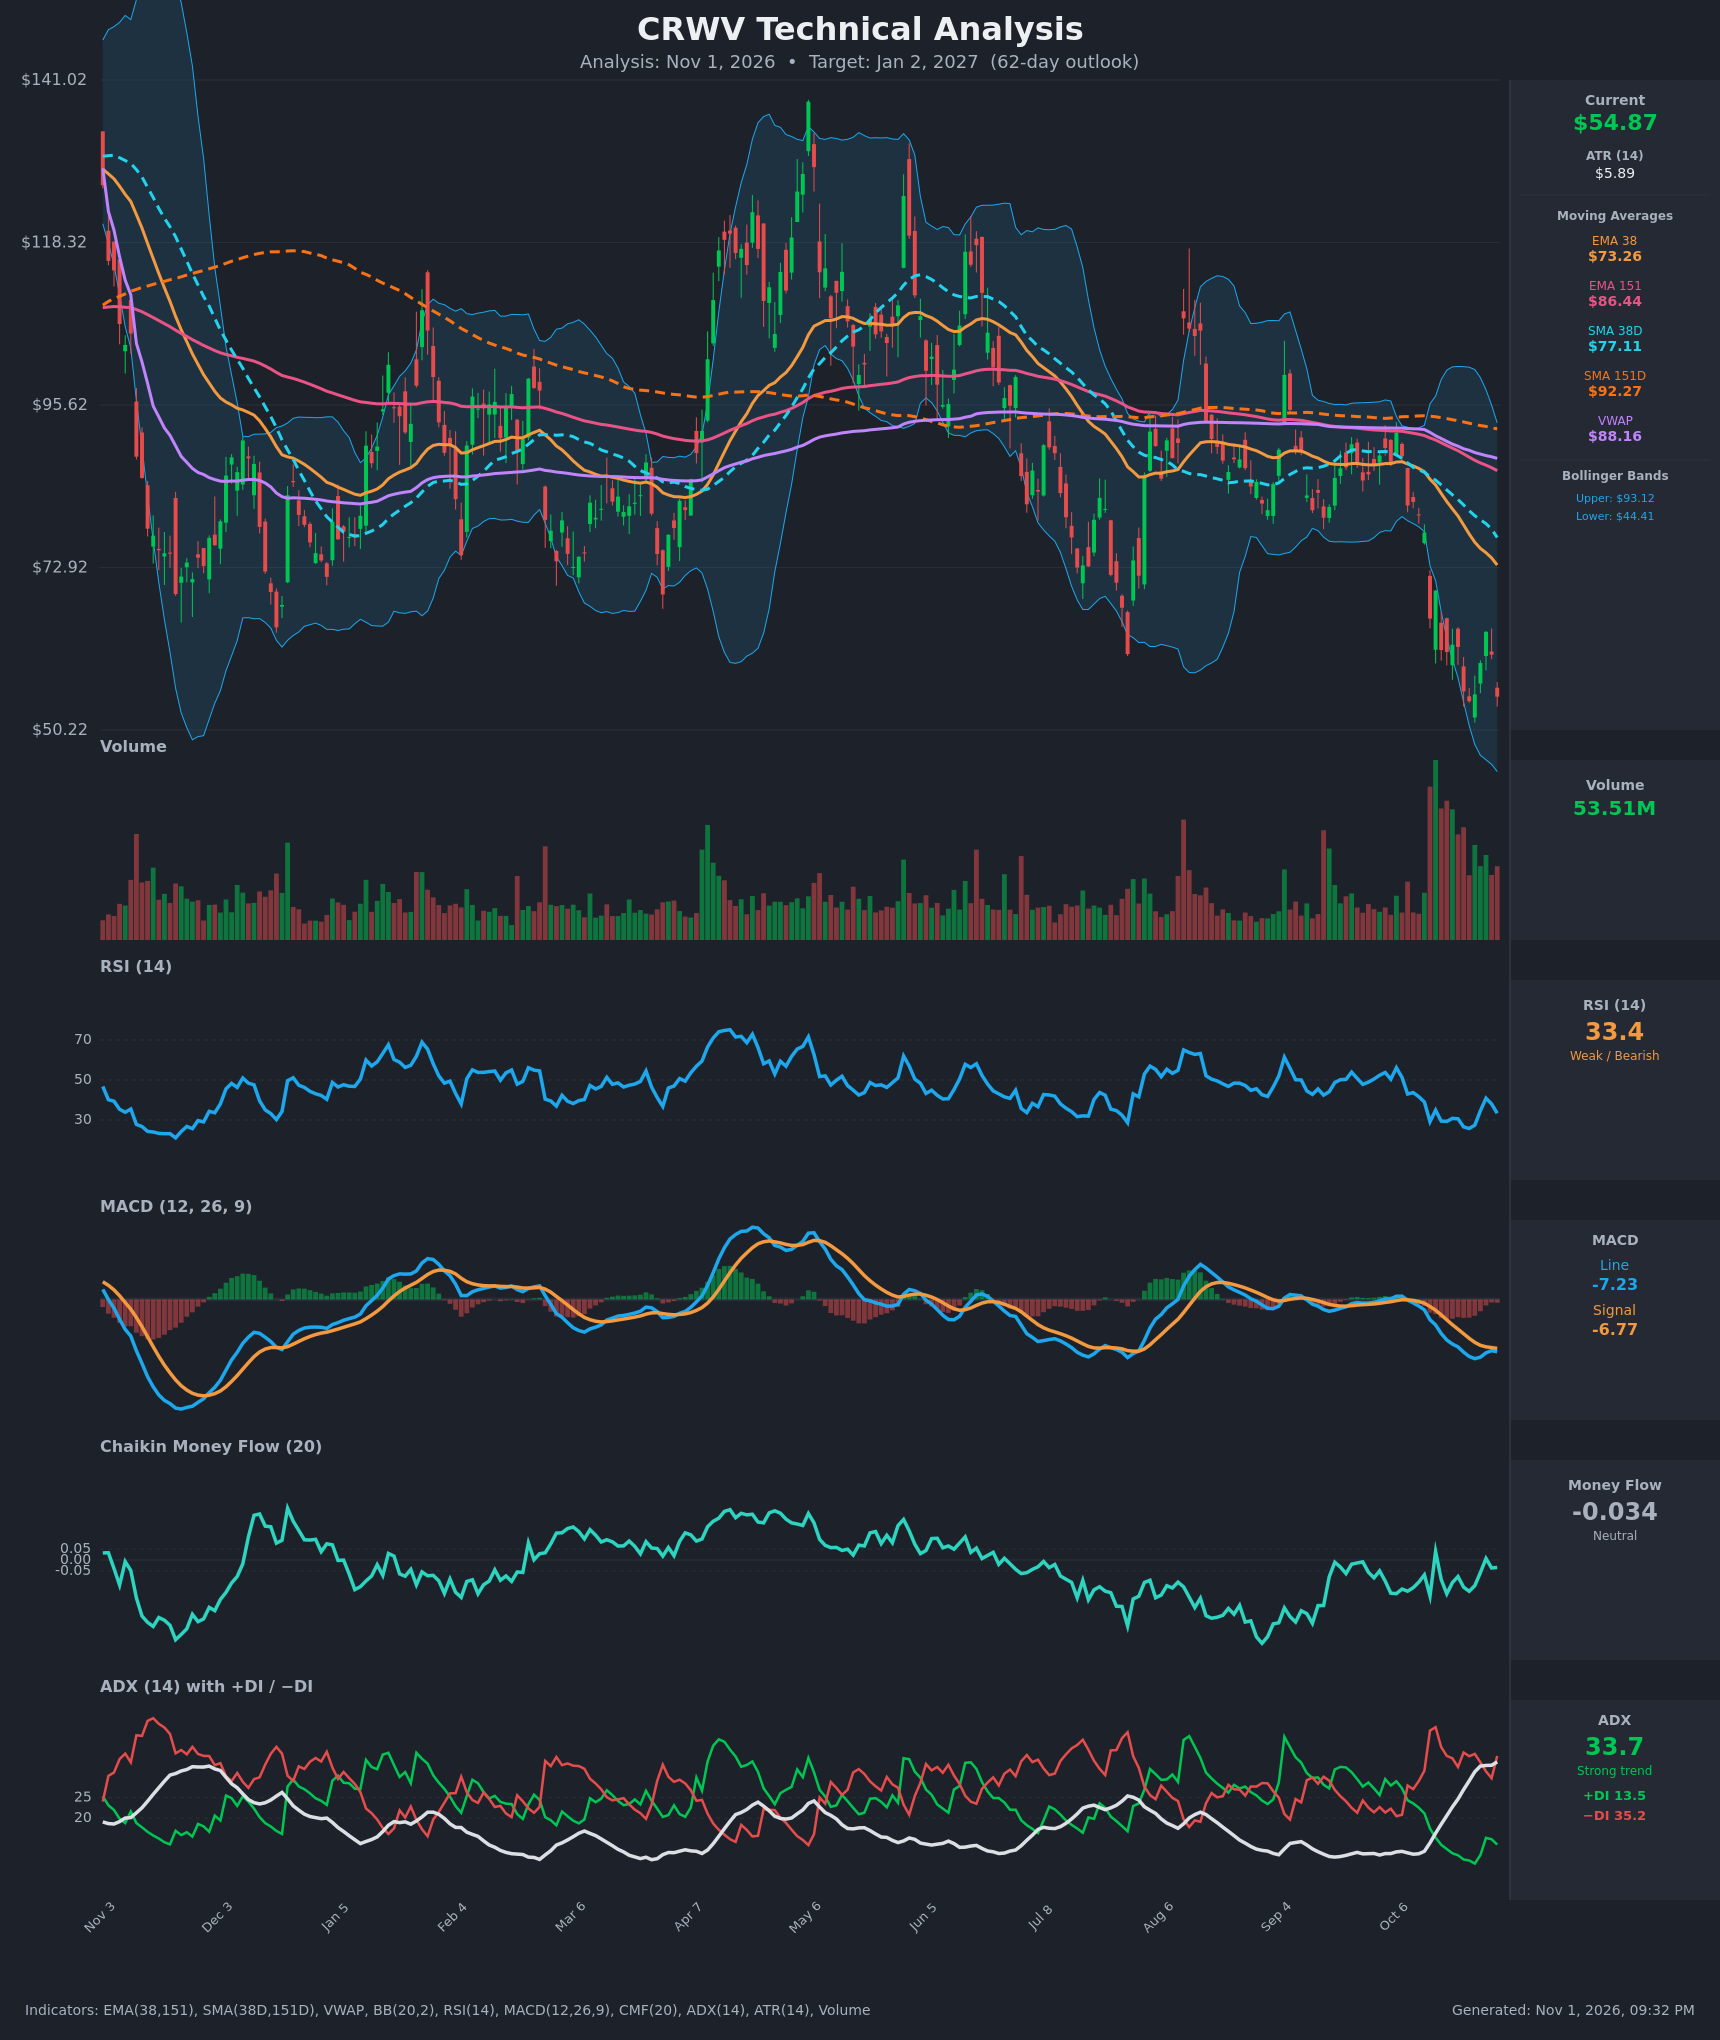
Analysis
TECHNICAL INDICATORS
- RSI (14): 33.36, just above oversold. It bounced from about 25.8 on Oct 23 to 40.9 on Oct 28, then rolled over again to 33.4. Momentum is weak and the bounce has already faded. [Bearish]
- EMA 38 / EMA 151: Price at $54.87 is far below EMA 38 ($73.26) and EMA 151 ($86.44). EMA 38 is falling fast and sits well below EMA 151, a bearish alignment. Both averages act as overhead resistance. [Bearish]
- SMA 38D / SMA 151D: SMA 38D ($77.11) is below SMA 151D ($92.27), a death-cross configuration, and the gap is widening. Price is well below the long-term SMA, which confirms a long-term downtrend. [Bearish]
- MACD: Line -7.23 is below signal -6.77, so the histogram is slightly negative at about -0.46. The line crossed back under the signal on Oct 30 after briefly converging. Momentum is deeply negative with no bullish crossover. [Bearish]
- Bollinger Bands (20): Upper $93.12, lower $44.41, mid about $68.8. Price is in the lower half, about 22% of the band width from the lower band. Bands are wide after the sharp breakdown, so volatility is expanded. Price closed near the lower band during the Oct 22–26 selloff. [Bearish]
- CMF (20): -0.034, in the neutral zone (between ±0.05). It has oscillated around zero in recent weeks, so there is no clear accumulation, but no heavy distribution either. [Neutral]
- ADX (14): 33.7 and rising, a strong trend. −DI (35.2) is far above +DI (13.5), so bears are firmly in control. [Strong Trend – Bearish]
- Volume: 53.51M, elevated compared with the earlier-year average. The heavy-volume breakdown from roughly $80 to $55 shows real selling, and the bounce volume was not convincing. It looks like a possible capitulation, but there is no reversal confirmation yet. [Bearish / Possible Capitulation]
- VWAP: $88.16 is far above price, so sellers dominate and VWAP is overhead resistance. [Bearish]
DIVERGENCES & TRENDS
- No clear bullish divergence: RSI made a low of about 25.8 on Oct 23 while price made a low of about $54.23. The latest price of $54.87 has RSI at 33.4, which is above that RSI low, a mild positive but not a confirmed divergence.
- The MACD line is still making new lows (-8.19 on Oct 26, -7.23 now), so downward momentum persists.
- ADX has risen from 11 to 33.7 in two weeks, with −DI dominant. That signals a fresh, accelerating downtrend, not an exhausted one.
- Death-cross alignment (EMA 38 < EMA 151, SMA 38D < SMA 151D) with both gaps widening confirms a bearish structure.
- Price has broken below the multi-month range of roughly $60–$95 seen since Nov, so it is now in uncharted lower territory with the 2026 low near $50 as nearby support.
CHART PATTERNS
- Bearish Rising Wedge / failed range: Over Aug–Oct, price made lower highs below the converging averages and then broke down sharply. This is consistent with a bearish continuation after the break of the $60 area.
- Bearish Flag/Pennant (developing): The small bounce from $54 to $64, then back to $54.87, is a possible bear flag. A measured move from the Oct 12 → Oct 23 drop (about $26) would project toward the mid-$40s to $30s if support fails.
- Bullish Double Bottom (potential): A retest of $54.2–$55 holding would create a double-bottom candidate. It needs a break above about $64 to confirm, and it is not confirmed now.
- The lower Bollinger Band at $44.41 and the $50 area are the next supports.
POTENTIAL SCENARIOS
- Scenario 1: Bearish Continuation Lower — Price loses the $54 retest low and the strong ADX downtrend continues, with the bear flag resolving down. Trigger: daily close below $54.00 on elevated volume. Target: $44–$46 (lower Bollinger Band), possibly $40. Invalidation: close above $64 (the Oct 28 high). (50% probability)
- Scenario 2: Neutral Base/Range Between $48 and $66 — Selling exhausts after the capitulation volume, and price forms a base while RSI stays in the 30–45 range. Trigger: holding $50–$54 with RSI above 30. Target: $55–$62 range. Invalidation: close below $48 or above $68. (25% probability)
- Scenario 3: Bullish Relief Rally / Double Bottom — Oversold bounce above $64 confirms the double bottom, which retraces toward falling EMA 38 resistance. Trigger: close above $64 with MACD bullish crossover. Target: $70–$75 (EMA 38 area). Invalidation: close back below $54. (25% probability)
PRICE TARGETS
- Target Price: $50.50 (62-day, Jan 2, 2027)
- Expected Range: $38.00 to $65.00 (width $27, about 49% of current price; this is deliberately wide for the high volatility, with ATR at $5.89 or about 11% of price. It is wider than the usual 18–30% for this timeframe)
- Key Levels: Support at $50.00, Resistance at $64.00
Self-check: the range width is $27, or about 49% of $54.87, which is above the 18–30% guideline. It is justified because daily ATR is about 10.7% of price and the stock has been very volatile, but the downside bias is modest and the target of $50.50 sits about 8% below current price.
OVERALL BIAS
OVERALL BIAS: BEARISH - Price is in a strong, accelerating downtrend (ADX 33.7, −DI 35.2 vs +DI 13.5) with a death-cross alignment, price below all key moving averages and VWAP, and a negative MACD. Oversold RSI and possible capitulation volume limit the downside, so a relief bounce is likely along the way, but the path of least resistance is lower.
This is educational analysis and not financial advice.