DELL 62-day bearish forecast — Nov 1, 2026
- Bias: Bearish
- Timeframe: 62 days (made Nov 1, 2026, target date Jan 1, 2027)
- Price at analysis: $424.30
- Price target: $385.00
- Expected range: $325.00 – $450.00
- Result: Pending — graded after the close on Jan 1, 2027
Get a free AI analysis of DELL today
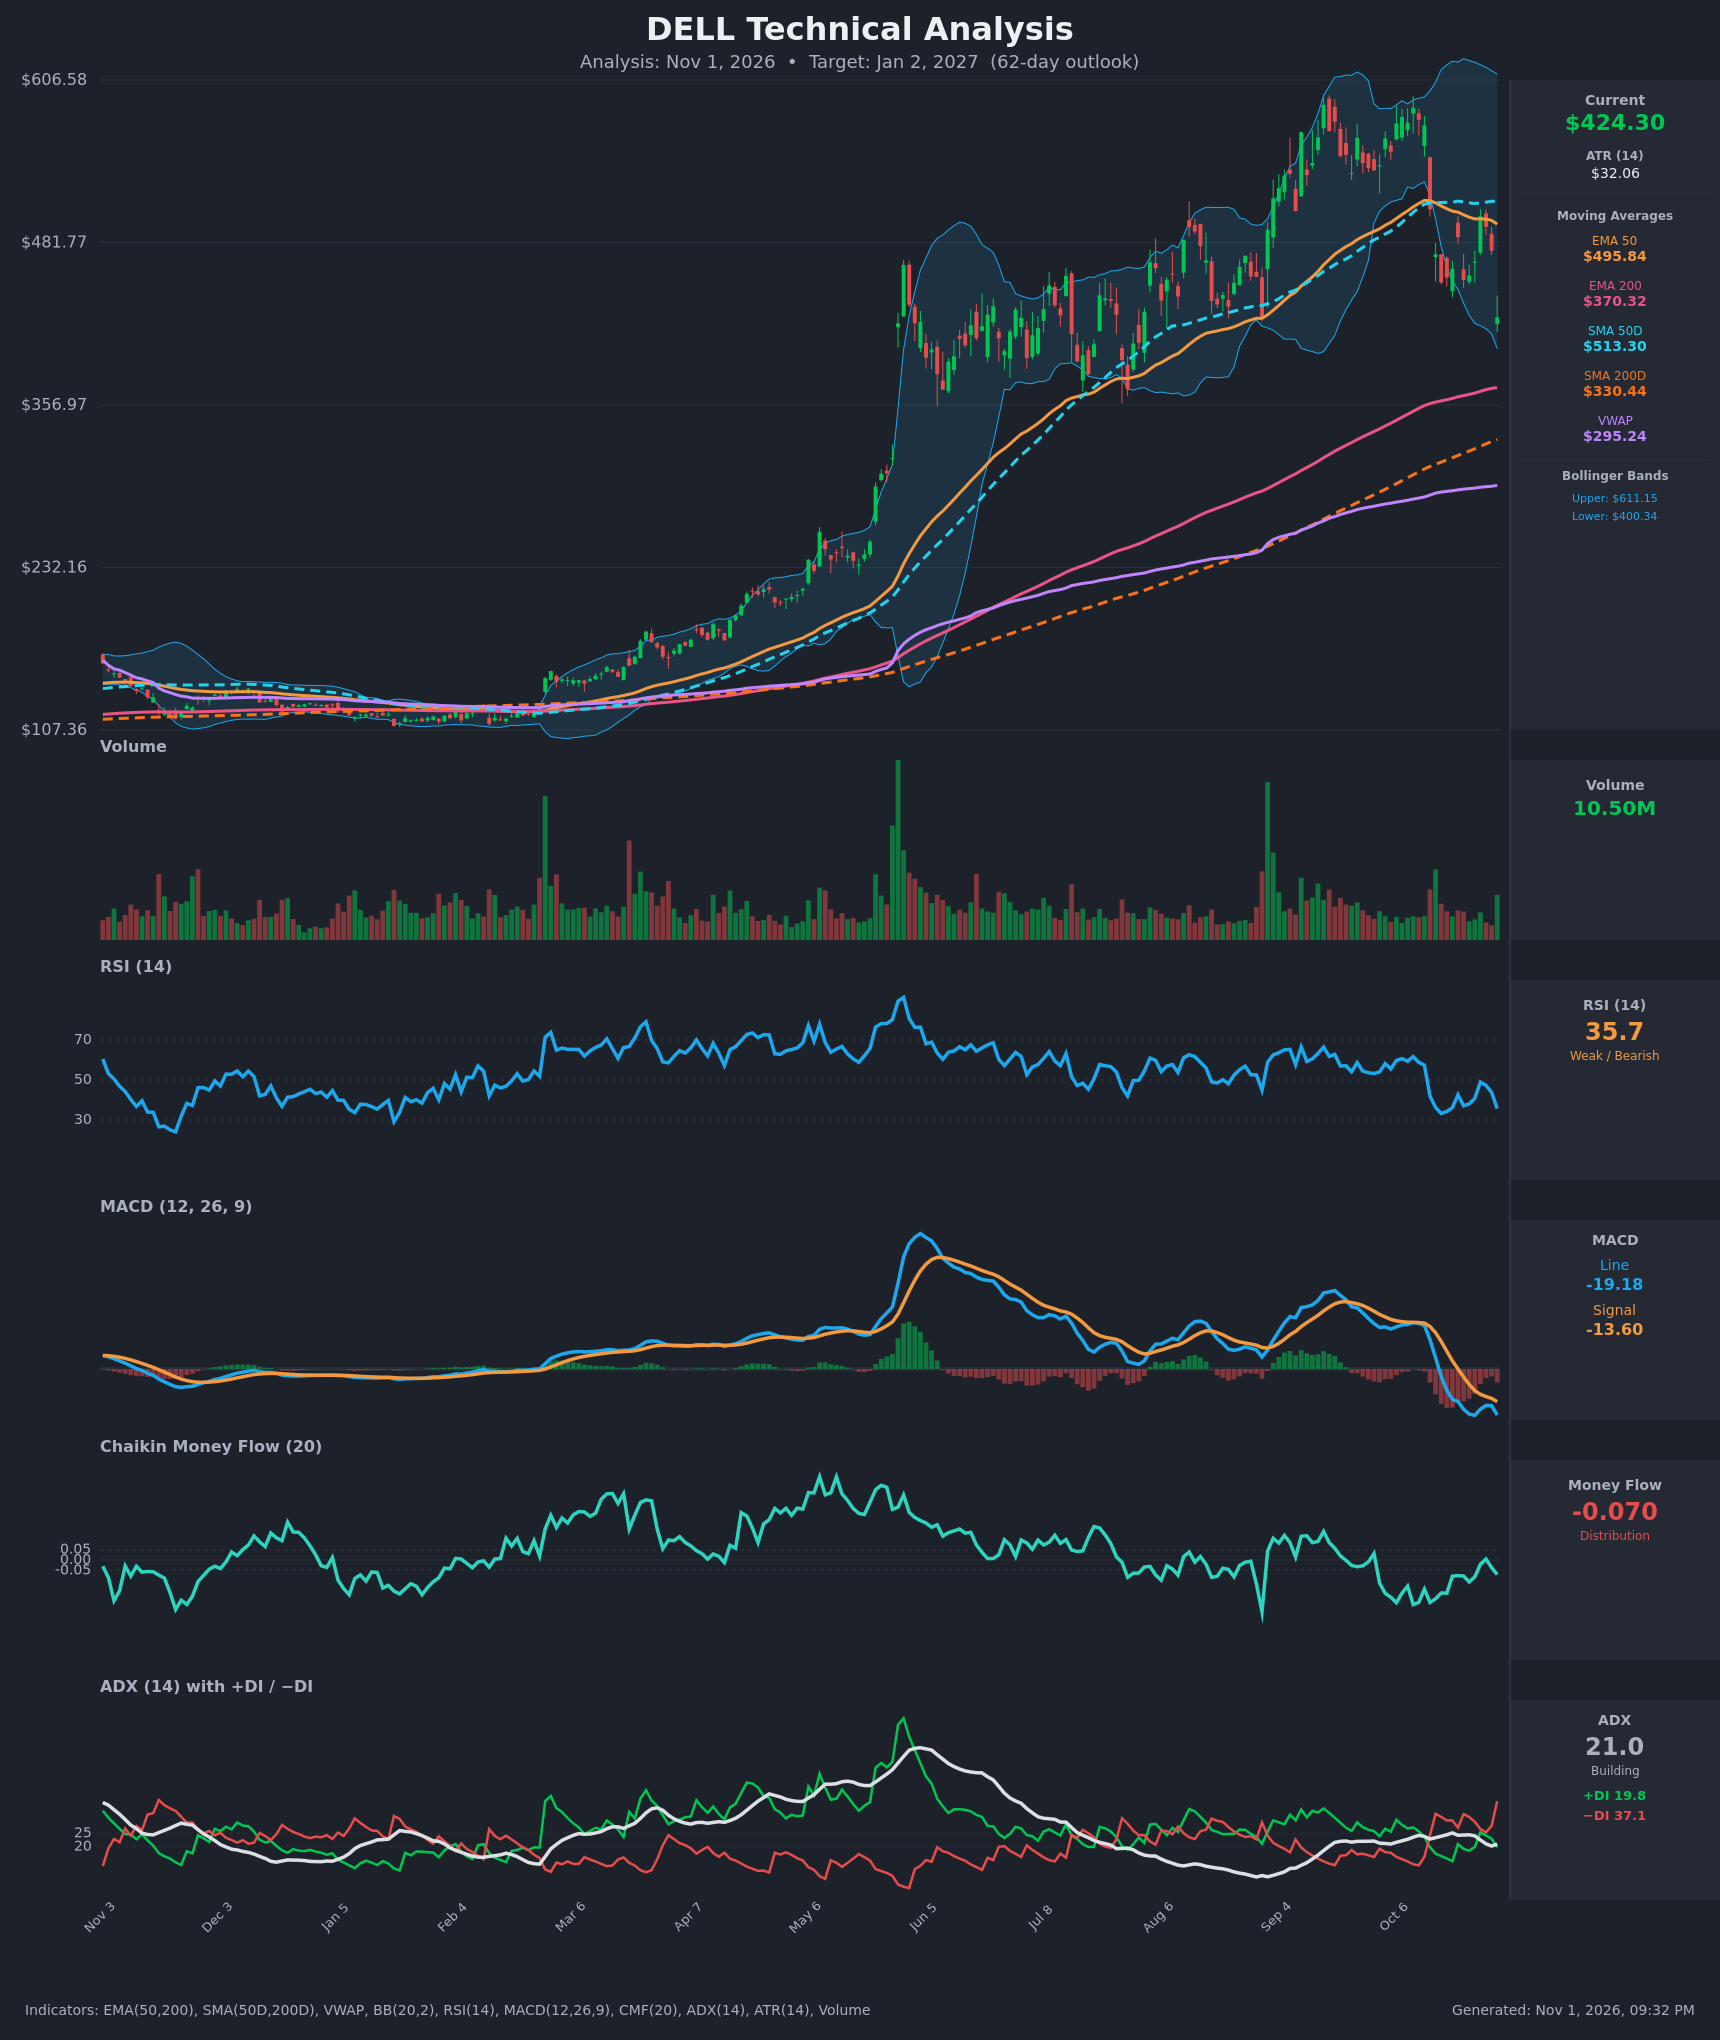
Analysis
TECHNICAL INDICATORS
- RSI (14): 35.74, down from 49 on Oct 27 and 58.8 on Oct 12. It is approaching oversold (30) but not there yet. The Oct 16 low of 33.2 was followed by a weak bounce that failed at 49, so momentum is still pointing down. [Bearish]
- 20 EMA: The 20 EMA value isn't supplied, but the chart shows price well below its short-term average after the roughly 26% drop from $576 to $424. Against the supplied EMA 50 ($495.84), price is about 14% below, so the average acts as overhead resistance. EMA 50 is now falling (it was $514 on Oct 13). [Bearish]
- MACD: The line (-19.18) is below the signal (-13.60) and both are below zero. The bearish crossover happened around Oct 16, and the line made a new low on Oct 30 after a brief recovery. The histogram is negative and widening again. [Bearish]
- Bollinger Bands (20): Price at $424.30 sits just above the lower band ($400.34), against an upper band of $611.15. The bands are wide, so volatility is high. Price has moved from the upper half of the bands to near the lower band, showing a clear loss of trend. A band walk lower is possible, though a mean-reversion bounce is also plausible. [Bearish]
- CMF (20): -0.070, below the -0.05 threshold. It has been mostly negative or near zero since September, with a brief touch of +0.005 on Oct 28 that failed. That points to persistent distribution. [Distribution]
- ADX (14): 21.0 with -DI at 37.1 and +DI at 19.8. -DI has been on top since Oct 14 and the gap is widening sharply. ADX is low and just turning up, so the downtrend is young and not yet confirmed as strong. Direction clearly favors the bears. [Weak Trend, Bearish direction]
- Volume: 10.50M on the latest bar, which is average to slightly above recent levels and well below the capitulation-style spikes seen earlier in the year. The selloff did not come with a washout volume spike, so a definitive capitulation low is not confirmed. [Neutral to mildly bearish]
Other supplied levels:
- Long-term structure: Price is above EMA 200 ($370.32) and SMA 200 ($330.44), so the long-term uptrend is intact. EMA 50 is above EMA 200 and SMA 50 ($513.30) is above SMA 200, so there is no death cross yet.
- VWAP: Price is well above VWAP ($295.24). This is a longer-term cushion, but it is far away.
DIVERGENCES & TRENDS
- No clear bullish RSI divergence. The Oct 16 low had RSI of 33.2 and the new Oct 30 low has 35.7, but price made a much lower low ($424 vs $451), so RSI is only marginally less weak. This is a minor sign of fading downside momentum and not a reliable reversal signal.
- MACD made a new low (-19.18) on the latest bar, so momentum confirms the price low rather than diverging.
- The MACD bearish crossover (Oct 16) and the -DI over +DI crossover (Oct 14) both fired within the last three weeks and are still in force.
- Price broke below the EMA 50 and SMA 50 with a gap-like drop on Oct 14-15 (-11%, then -7%), and it just broke the Oct 16 swing low near $451.
- The EMA 50/200 and SMA 50/200 gaps remain wide and positive, but EMA 50 and SMA 50 are rolling over and the gap to the 200-period averages is shrinking.
- ADX is rising from a low base, suggesting a new downtrend is trying to form after months of a strong uptrend.
CHART PATTERNS
- Bearish Double Top (reversal), tentative: The two highs in the $570-$590 area (September-October) are followed by a break below the recent swing-low "neckline" near $451. The measured move from roughly $585 down to $451 is about $135, implying a target near $315, close to the SMA 200 ($330). That is the extended downside case, and in practice the $370 EMA 200 is the first major magnet.
- Broken ascending channel: The rising channel from the May breakout has failed, with price falling out of the lower half of the trend structure. This is a secondary bearish confirmation.
- Risk to the pattern: A reclaim of $475-$495 (the Oct 29 close, then the EMA 50) would invalidate the breakdown and turn it into a failed break, so the pattern is only tentatively confirmed.
POTENTIAL SCENARIOS
- Scenario 1: Bearish Continuation to EMA 200 — Price keeps trending lower after the break of the $451 swing low. Sellers (-DI 37, CMF -0.07) stay in control and price drifts toward the rising EMA 200, with possible overshoot toward the SMA 200 and the double-top measured move. Trigger: daily close below the $400 lower Bollinger Band. Target: $370 first, then $330-$345. Invalidation: daily close back above $475. (55% probability)
- Scenario 2: Bullish Oversold Rebound — RSI approaches 30, price bounces from the lower band, and the long-term uptrend (price above both 200-period averages) attracts dip buyers. The bounce stalls at the falling EMA 50 as resistance. Trigger: reclaim of $460 with rising volume. Target: $485-$495. Invalidation: close below $400. (30% probability)
- Scenario 3: Neutral Consolidation — Price ranges between the lower band near $400 and $460 while ADX stays near 20. Trigger: several closes between $400 and $460. Target: $410-$440. Invalidation: close outside $395-$465. (15% probability)
PRICE TARGETS
- Target Price: $385.00 (62 days, Jan 2, 2027). This sits between the EMA 200 ($370) and current price, reflecting a probable test of the 200-period average with some bounce risk.
- Expected Range: $325.00 to $450.00. Width is $125, which is about 29.5% of the current price and matches the 61-180 day guidance (18-30%).
- Key Levels: Support at $370.32 (EMA 200); Resistance at $486.00 (Oct 21 swing high, with the EMA 50 at $495.84 just above).
OVERALL BIAS
OVERALL BIAS: BEARISH - Price has broken below the EMA 50 and SMA 50. MACD is bearish below zero, -DI (37.1) dominates +DI (19.8), CMF shows distribution at -0.070, and a tentative double-top breakdown points toward the $370 EMA 200 test. The long-term trend remains up, so the drop should be contained near the 200-period averages.
This is educational analysis and not financial advice.