IBIT 62-day bearish forecast — Nov 1, 2026
- Bias: Bearish
- Timeframe: 62 days (made Nov 1, 2026, target date Jan 1, 2027)
- Price at analysis: $43.36
- Price target: $41.20
- Expected range: $36.00 – $47.00
- Result: Pending — graded after the close on Jan 1, 2027
Get a free AI analysis of IBIT today
Analysis
TECHNICAL INDICATORS
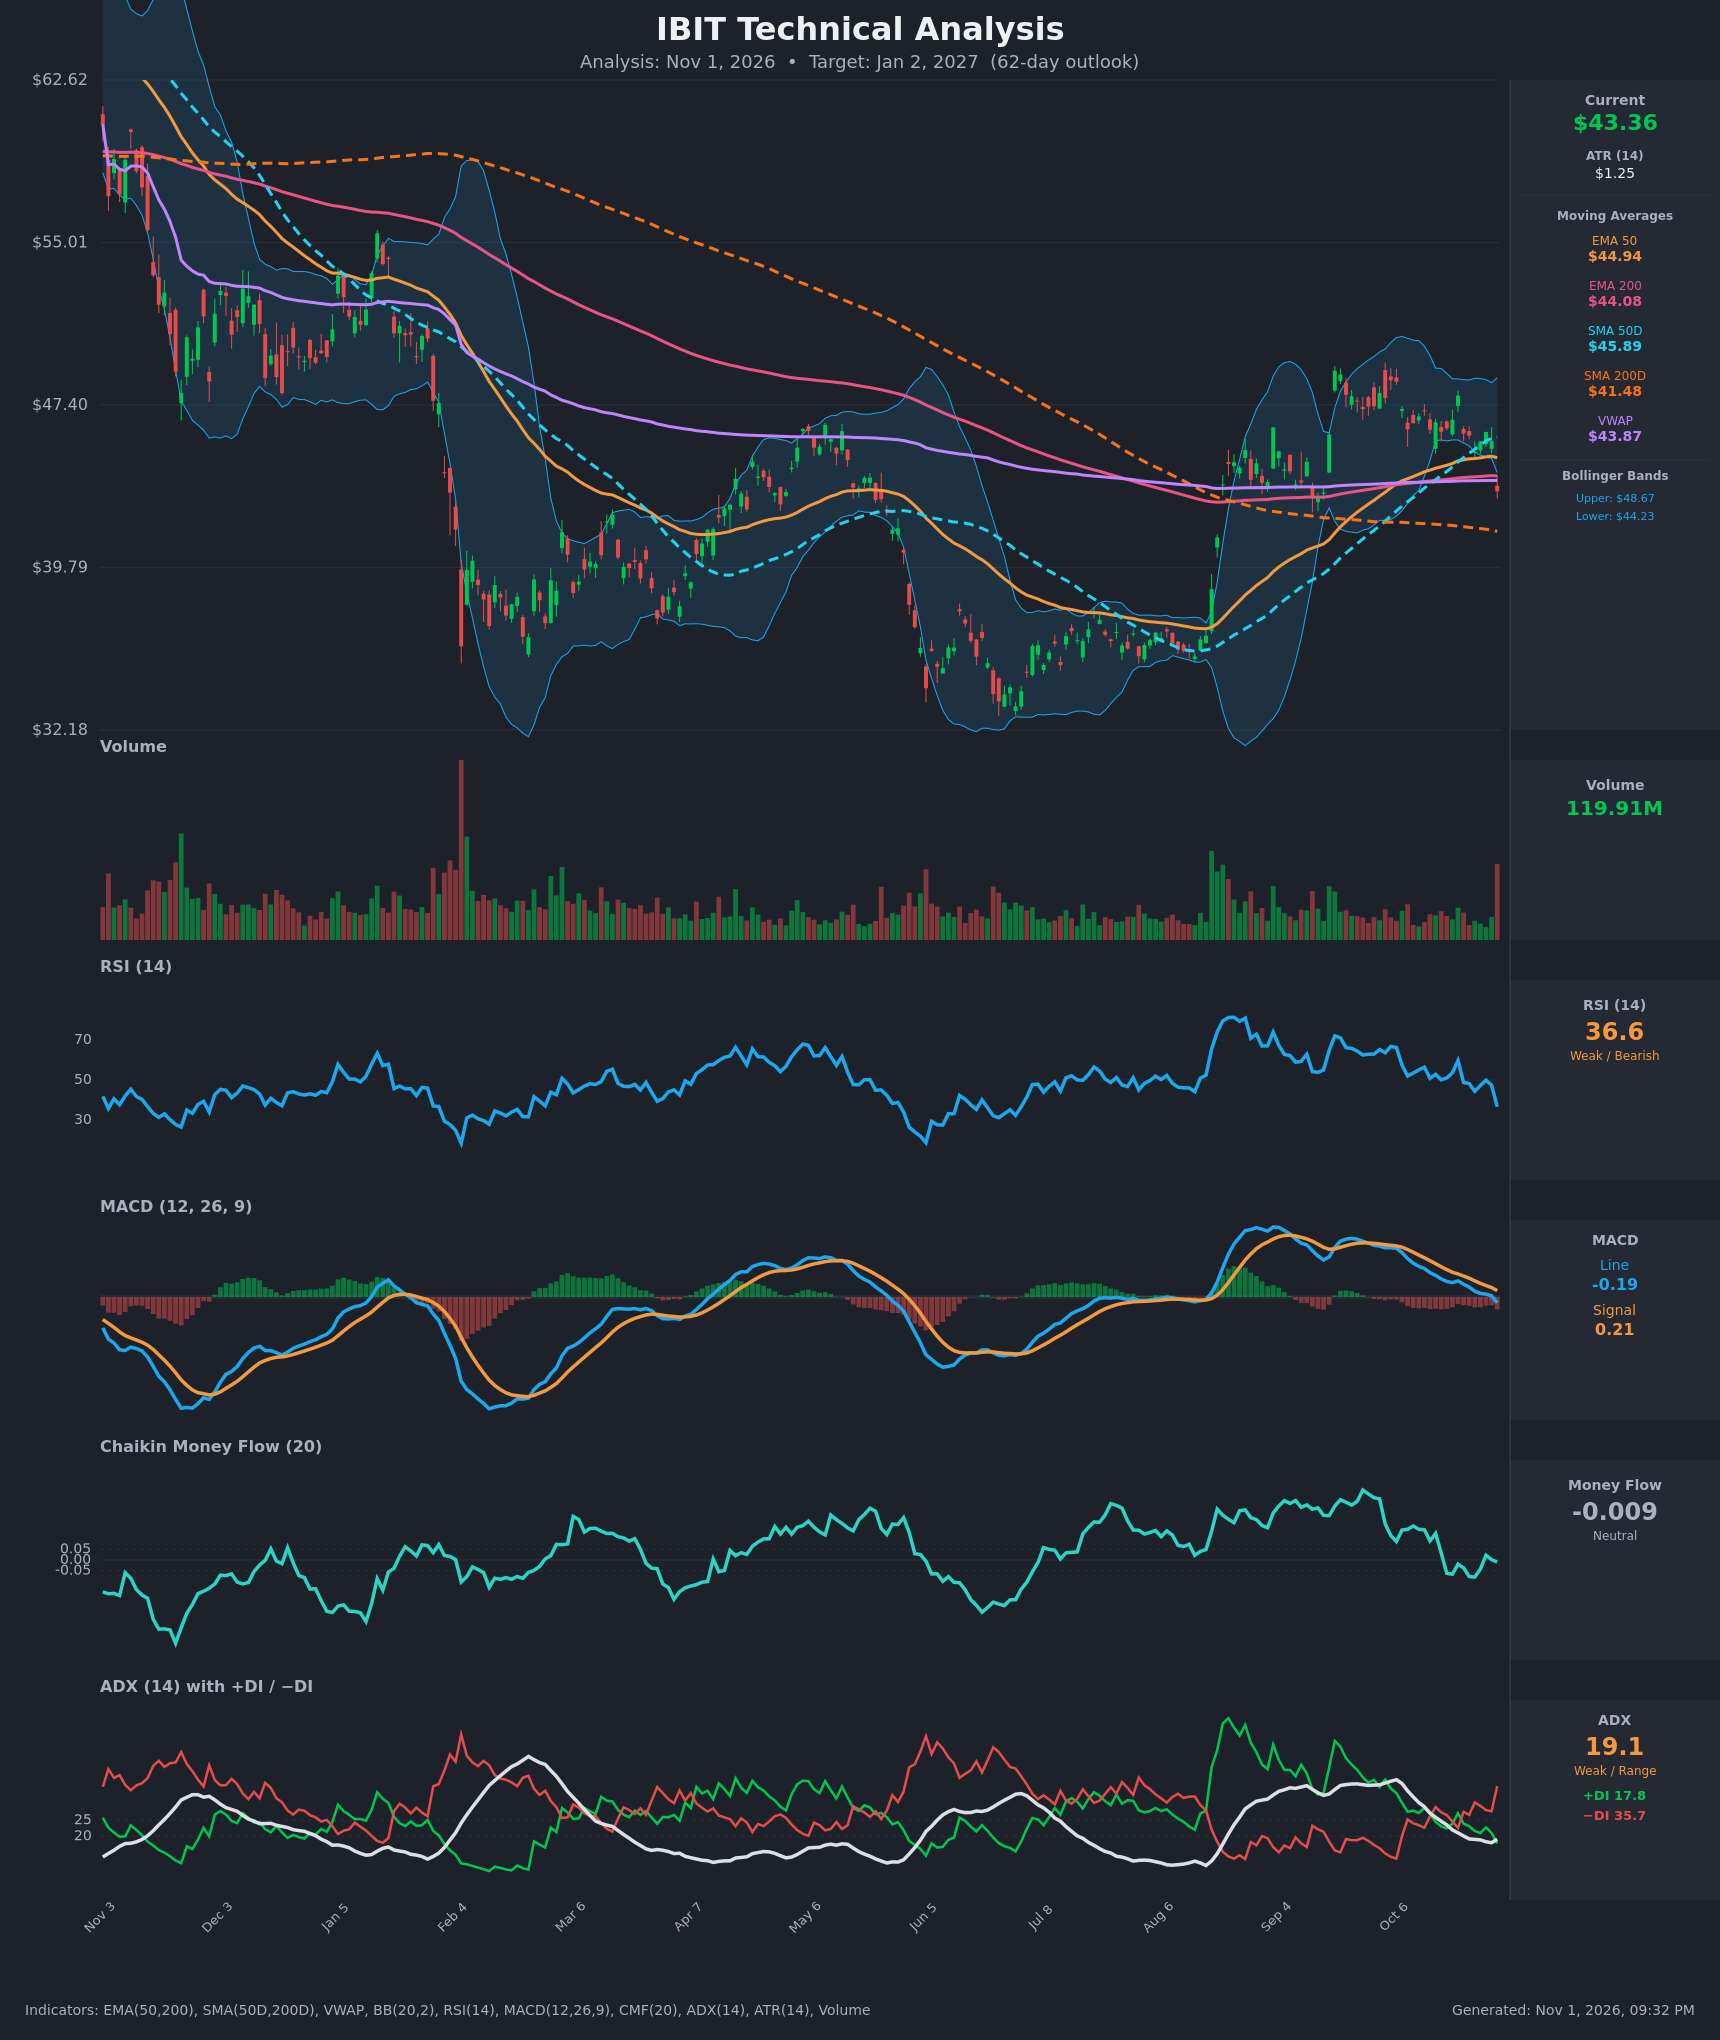
- RSI (14): 36.64, down sharply from ~47–50 on Oct 28–29 and approaching oversold (30). Momentum is clearly rolling over, and the one-day drop from 47.4 to 36.6 reflects a single heavy selloff bar. [Bearish]
- 20 EMA: The 20 EMA is not supplied. Price at $43.36 sits below the EMA 50 ($44.94), EMA 200 ($44.08), SMA 50D ($45.89) and VWAP ($43.87). The cluster of moving averages overhead is now resistance. [Bearish]
- MACD: Line -0.188 crossed below the signal at 0.208 on the latest bar, a fresh bearish crossover. The histogram is negative (about -0.40), and the line has decayed steadily from +1.0 in mid-October. [Bearish]
- Bollinger Bands (20): Upper $48.67, lower $44.23. Price at $43.36 closed below the lower band, a breakdown or oversold extension. In a weak-ADX environment this often yields a bounce toward the mid-band (~$46.45), but a close below the band after a long range also signals downside momentum. [Bearish]
- CMF (20): -0.009, neutral (within ±0.05). It has deteriorated from +0.14 in mid-October, and the lack of heavy distribution tempers the bearish read. [Neutral]
- ADX (14): 19.1 with −DI (35.7) well above +DI (17.8). Trend strength is weak, but the DI spread is wide and widening, so sellers are in control. A rise in ADX above 20–25 would confirm a downtrend. [Weak Trend, bearish direction]
- Volume: 119.91M, the highest bar in recent months, on a large red candle (-5.1%). A heavy-volume breakdown suggests a real selling event or capitulation. [Bearish]
DIVERGENCES & TRENDS
- No bullish RSI divergence yet. RSI is making a lower high (the ~60 peak on Oct 21 was lower than the 70+ peak in Aug), consistent with fading momentum.
- The SMA 50D ($45.89) is above the SMA 200D ($41.48), so the golden cross is intact. It is flattening and about to roll over as price falls, while price remains above the SMA 200D (long-term support near $41.5).
- EMA 50 ($44.94) is above EMA 200 ($44.08) but the gap is narrowing, so a bearish EMA crossover is possible in the coming weeks.
- MACD turned from a steady decline to a bearish signal cross, and the −DI/+DI crossover on Oct 14–15 has now extended into a wide gap.
- Price broke below VWAP ($43.87) and the entire 44–46 moving-average cluster in one bar.
- The broader chart shows a long downtrend from ~$62 to a ~$33 low, then a recovery into a $43–49 range since August. Price has now lost the bottom of that range.
CHART PATTERNS
- Range top and rounded rollover / possible Bearish Double Top: Highs near $47.8–49 (Sep and Oct 21) form a double-top-like structure with neckline near $43–44. Today's close at $43.36 is a break of that neckline. The measured move (peak ~$48.5 minus neckline ~$43.5 = ~$5) targets roughly $38.5–39.
- A cautionary note: the August–October base is also a broad consolidation, and the SMA 200D at $41.5 plus the Aug breakout area ($42–43) offers support, so the decline may stall around $41–42 first.
- No confirmed bullish pattern is visible.
POTENTIAL SCENARIOS
- Scenario 1: Bearish Neckline Breakdown — The double-top breakdown continues with −DI dominance and a MACD bear cross, and price grinds toward the SMA 200D and the rising support zone. Trigger: daily closes below $43.00 and continued heavy volume. Target: $39.50–$41.50. Invalidation: daily close back above $45.90 (SMA 50D and EMA 50 zone). (50% probability)
- Scenario 2: Neutral/Choppy Range Retest — Oversold RSI and weak ADX produce a bounce that fails near the moving-average cluster, then price chops between $40 and $46. Trigger: reclaim of VWAP at $43.87 with no follow-through above $45. Target: $42–$45. Invalidation: close above $46.50 or below $40. (20% probability)
- Scenario 3: Bullish Failed Breakdown Reversal — The bar was a capitulation flush; price recovers the bands and moving averages and returns to the upper range. Trigger: close above $45 with a MACD re-cross. Target: $47–$49. Invalidation: close below $42. (30% probability)
PRICE TARGETS
- Target Price: $41.20 (62 days, Jan 2, 2027)
- Expected Range: $36.00 to $47.00 (width $11.00, about 25% of current price, consistent with the 61–180 day guidance of 18–30%)
- Key Levels: Support at $41.48 (SMA 200D, with $39.80 below it), Resistance at $44.94 (EMA 50, then $45.89 SMA 50D)
OVERALL BIAS
OVERALL BIAS: BEARISH - Price broke below the lower Bollinger Band, VWAP and all key moving averages on the heaviest volume in months, with a fresh MACD bear cross and −DI far above +DI. The likely path is a drift toward the SMA 200D (~$41.5) and possibly the high-$30s, though oversold RSI and the rising SMA 200D could cause stalls or bounces along the way.
This is educational analysis and not financial advice.