GOOGL 62-day bearish forecast — Nov 1, 2026
- Bias: Bearish
- Timeframe: 62 days (made Nov 1, 2026, target date Jan 1, 2027)
- Price at analysis: $279.84
- Price target: $270.00
- Expected range: $245.00 – $305.00
- Result: Pending — graded after the close on Jan 1, 2027
Get a free AI analysis of GOOGL today
Analysis
TECHNICAL INDICATORS
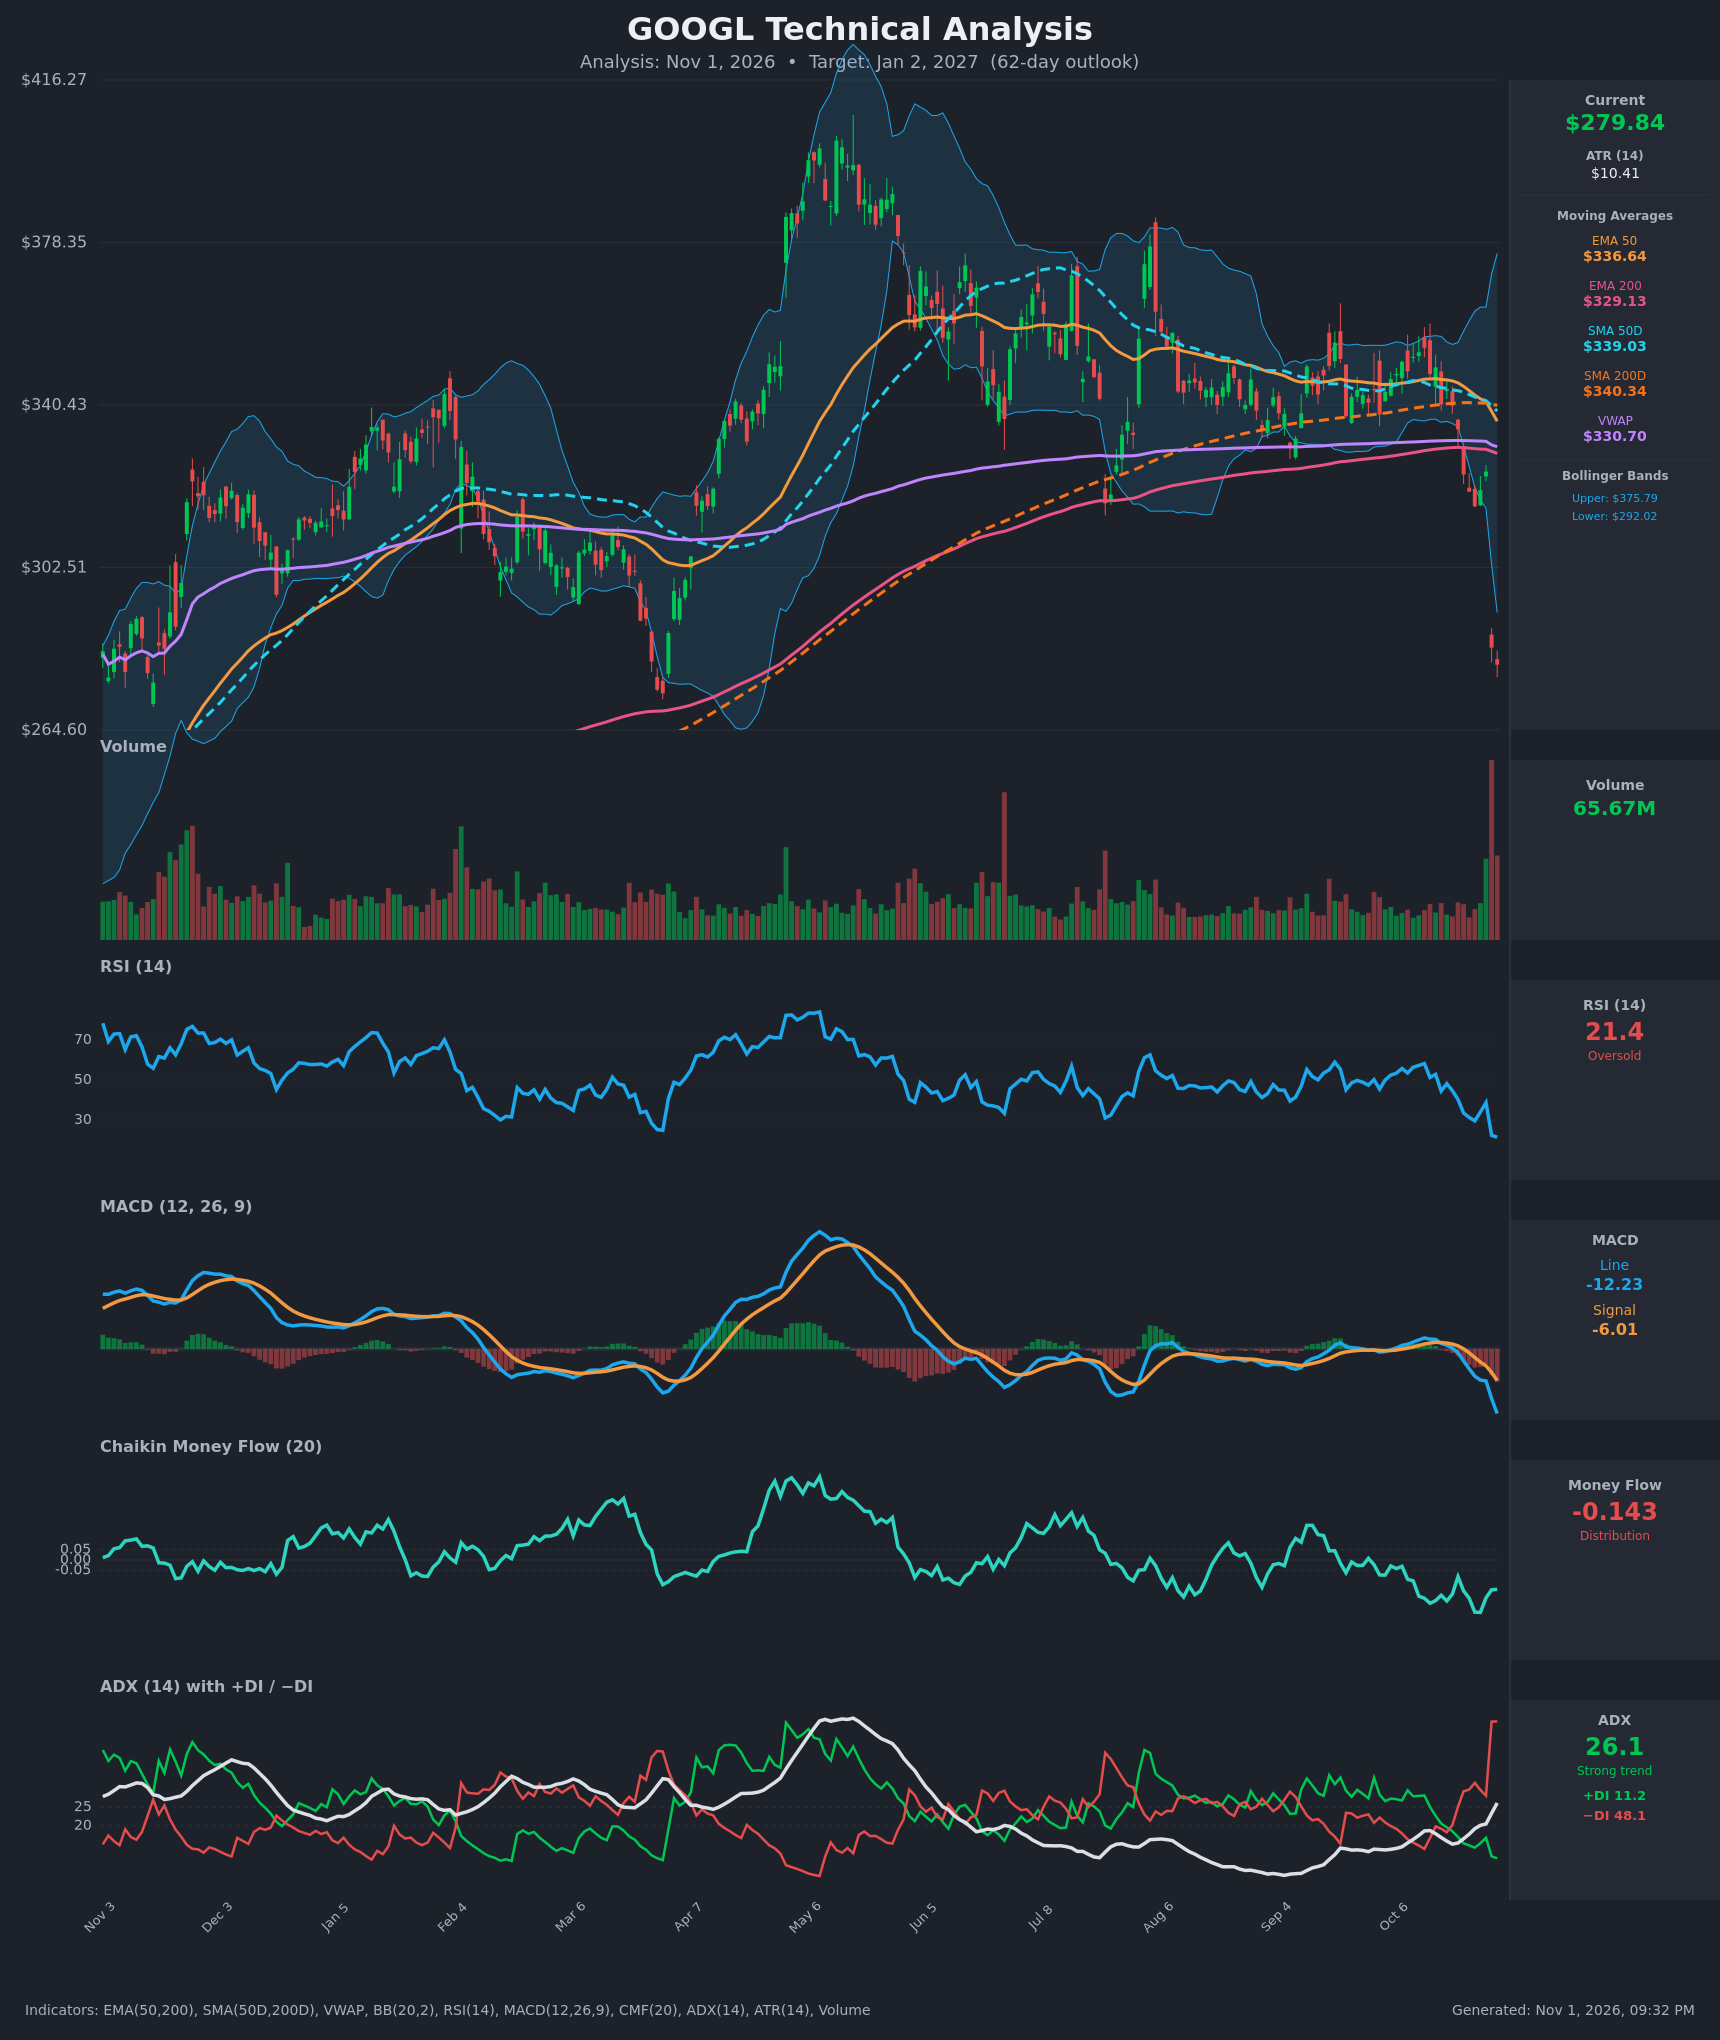
- RSI (14): 21.38, deeply oversold and down from 38.7 on Oct 28 and 57 in mid-October. Momentum is still falling, though the reading is stretched enough to allow a relief bounce. [Bearish]
- 20 EMA: The 20 EMA isn't supplied, but the EMA 50 at $336.64 and EMA 200 at $329.13 both sit 17-20% above price and are rolling over. Overhead moving averages act as resistance. [Bearish]
- MACD: Line -12.23 is well below signal -6.01, and the histogram is expanding negative. The bearish crossover occurred on Oct 21-22 and the gap keeps widening. [Bearish]
- Bollinger Bands (20): Upper $375.79, lower $292.02. Price at $279.84 is closed below the lower band, with the bands expanding sharply on the gap-down. This is a volatility-expansion breakdown, which is oversold but not yet a reversal. [Bearish]
- CMF (20): -0.143, well below -0.05 and stuck in negative territory for months. It shows persistent distribution, with only a small uptick off the low. [Distribution]
- ADX (14): 26.1 and rising from 15 two weeks ago, with −DI 48.1 far above +DI 11.2. This is a strong, newly established downtrend with bears firmly in control. [Strong Trend – Bearish]
- Volume: 65.67M on the latest bar, with the Oct 29 gap-down on the heaviest volume of the year. This is heavy selling, which could be capitulation but looks more like institutional repricing. [Bearish – high-volume breakdown]
DIVERGENCES & TRENDS
- There is no bullish RSI or MACD divergence. Both made new lows with price, so momentum confirms the move.
- A death cross occurred on Oct 29, when SMA50D ($339.03) fell below SMA200D ($340.34). It is a lagging but notable long-term trend signal.
- Price is far below SMA200D, VWAP ($330.70), and both EMAs, which confirms a long-term downtrend.
- EMA50 remains above EMA200 but is converging quickly (336.6 vs 329.1). A bearish EMA cross is likely within weeks.
- −DI spiked from 28 to 48 in one session, and ADX is turning up through 25, so trend strength is accelerating.
- An unfilled gap sits between $283.82 and $324.89. The 1-day drop of about 12.6% is roughly 4 ATRs.
- RSI near 21 is historically a level where relief bounces occur, but bounces in strong ADX downtrends tend to stall below the broken levels.
CHART PATTERNS
- Breakdown from a consolidation range. Price spent June to October in a $335-$375 range, then broke down through the range floor, the SMA200D and the EMA200 on a gap. This resembles the Bearish Rectangle / Descending breakdown structure from the reference diagram, with a measured move pointing to the $290s or lower.
- Gap-down with a large-volume bar. This is not a classic diagram pattern, but it behaves like a bearish continuation or breakaway gap. The risk is that a dead-cat bounce forms a Bearish Flag/Pennant below $325.
- Support zone: The April swing low near $272-$275 is the next structural support and sits just below price. A hold there would set up a Double Bottom with the April trough, which is the main bullish alternative.
POTENTIAL SCENARIOS
- Scenario 1: Bearish Trend Continuation — The strong ADX downtrend persists. Price retests or briefly breaks the April low zone, with failed bounces under the $292 band and the gap. Trigger: a daily close below $272 on continued −DI dominance. Target: $255-$265, with an extension to $245. Invalidation: a daily close above $305 that starts to fill the gap. (47% probability)
- Scenario 2: Bullish Oversold Relief Bounce / Double Bottom — RSI at 21 and a close below the lower band draw in dip buyers. Price holds the $272 area, forming a double bottom with April, and rallies into the gap. Trigger: a reclaim of $292 (lower band) with CMF turning above 0. Target: $305-$320. Invalidation: a close below $270. (38% probability)
- Scenario 3: Neutral Base Building — Price chops between $265 and $295 as the selling exhausts. Trigger: ADX rolling over below 25 with RSI recovering to 40. Target: about $280. Invalidation: a close outside $265-$295. (15% probability)
PRICE TARGETS
- Target Price: $270.00 (62-day, Jan 2, 2027)
- Expected Range: $245.00 to $305.00 (width $60 ≈ 21.4% of current price, consistent with the 61-180 day guidance)
- Key Levels: Support at $272.00, Resistance at $292.00
OVERALL BIAS
OVERALL BIAS: BEARISH - Price gapped below every major moving average on record volume. A fresh death cross, a bearish MACD, persistent CMF distribution, and ADX rising with −DI at 48 all point to a strong downtrend. The oversold RSI raises the odds of a bounce, but the trend evidence outweighs it, so the 62-day target sits modestly below current price.
This is educational analysis and not financial advice.