F 62-day bullish forecast — Nov 1, 2026
- Bias: Bullish
- Timeframe: 62 days (made Nov 1, 2026, target date Jan 1, 2027)
- Price at analysis: $12.25
- Price target: $12.85
- Expected range: $11.40 – $14.10
- Result: Pending — graded after the close on Jan 1, 2027
Get a free AI analysis of F today
Analysis
TECHNICAL INDICATORS
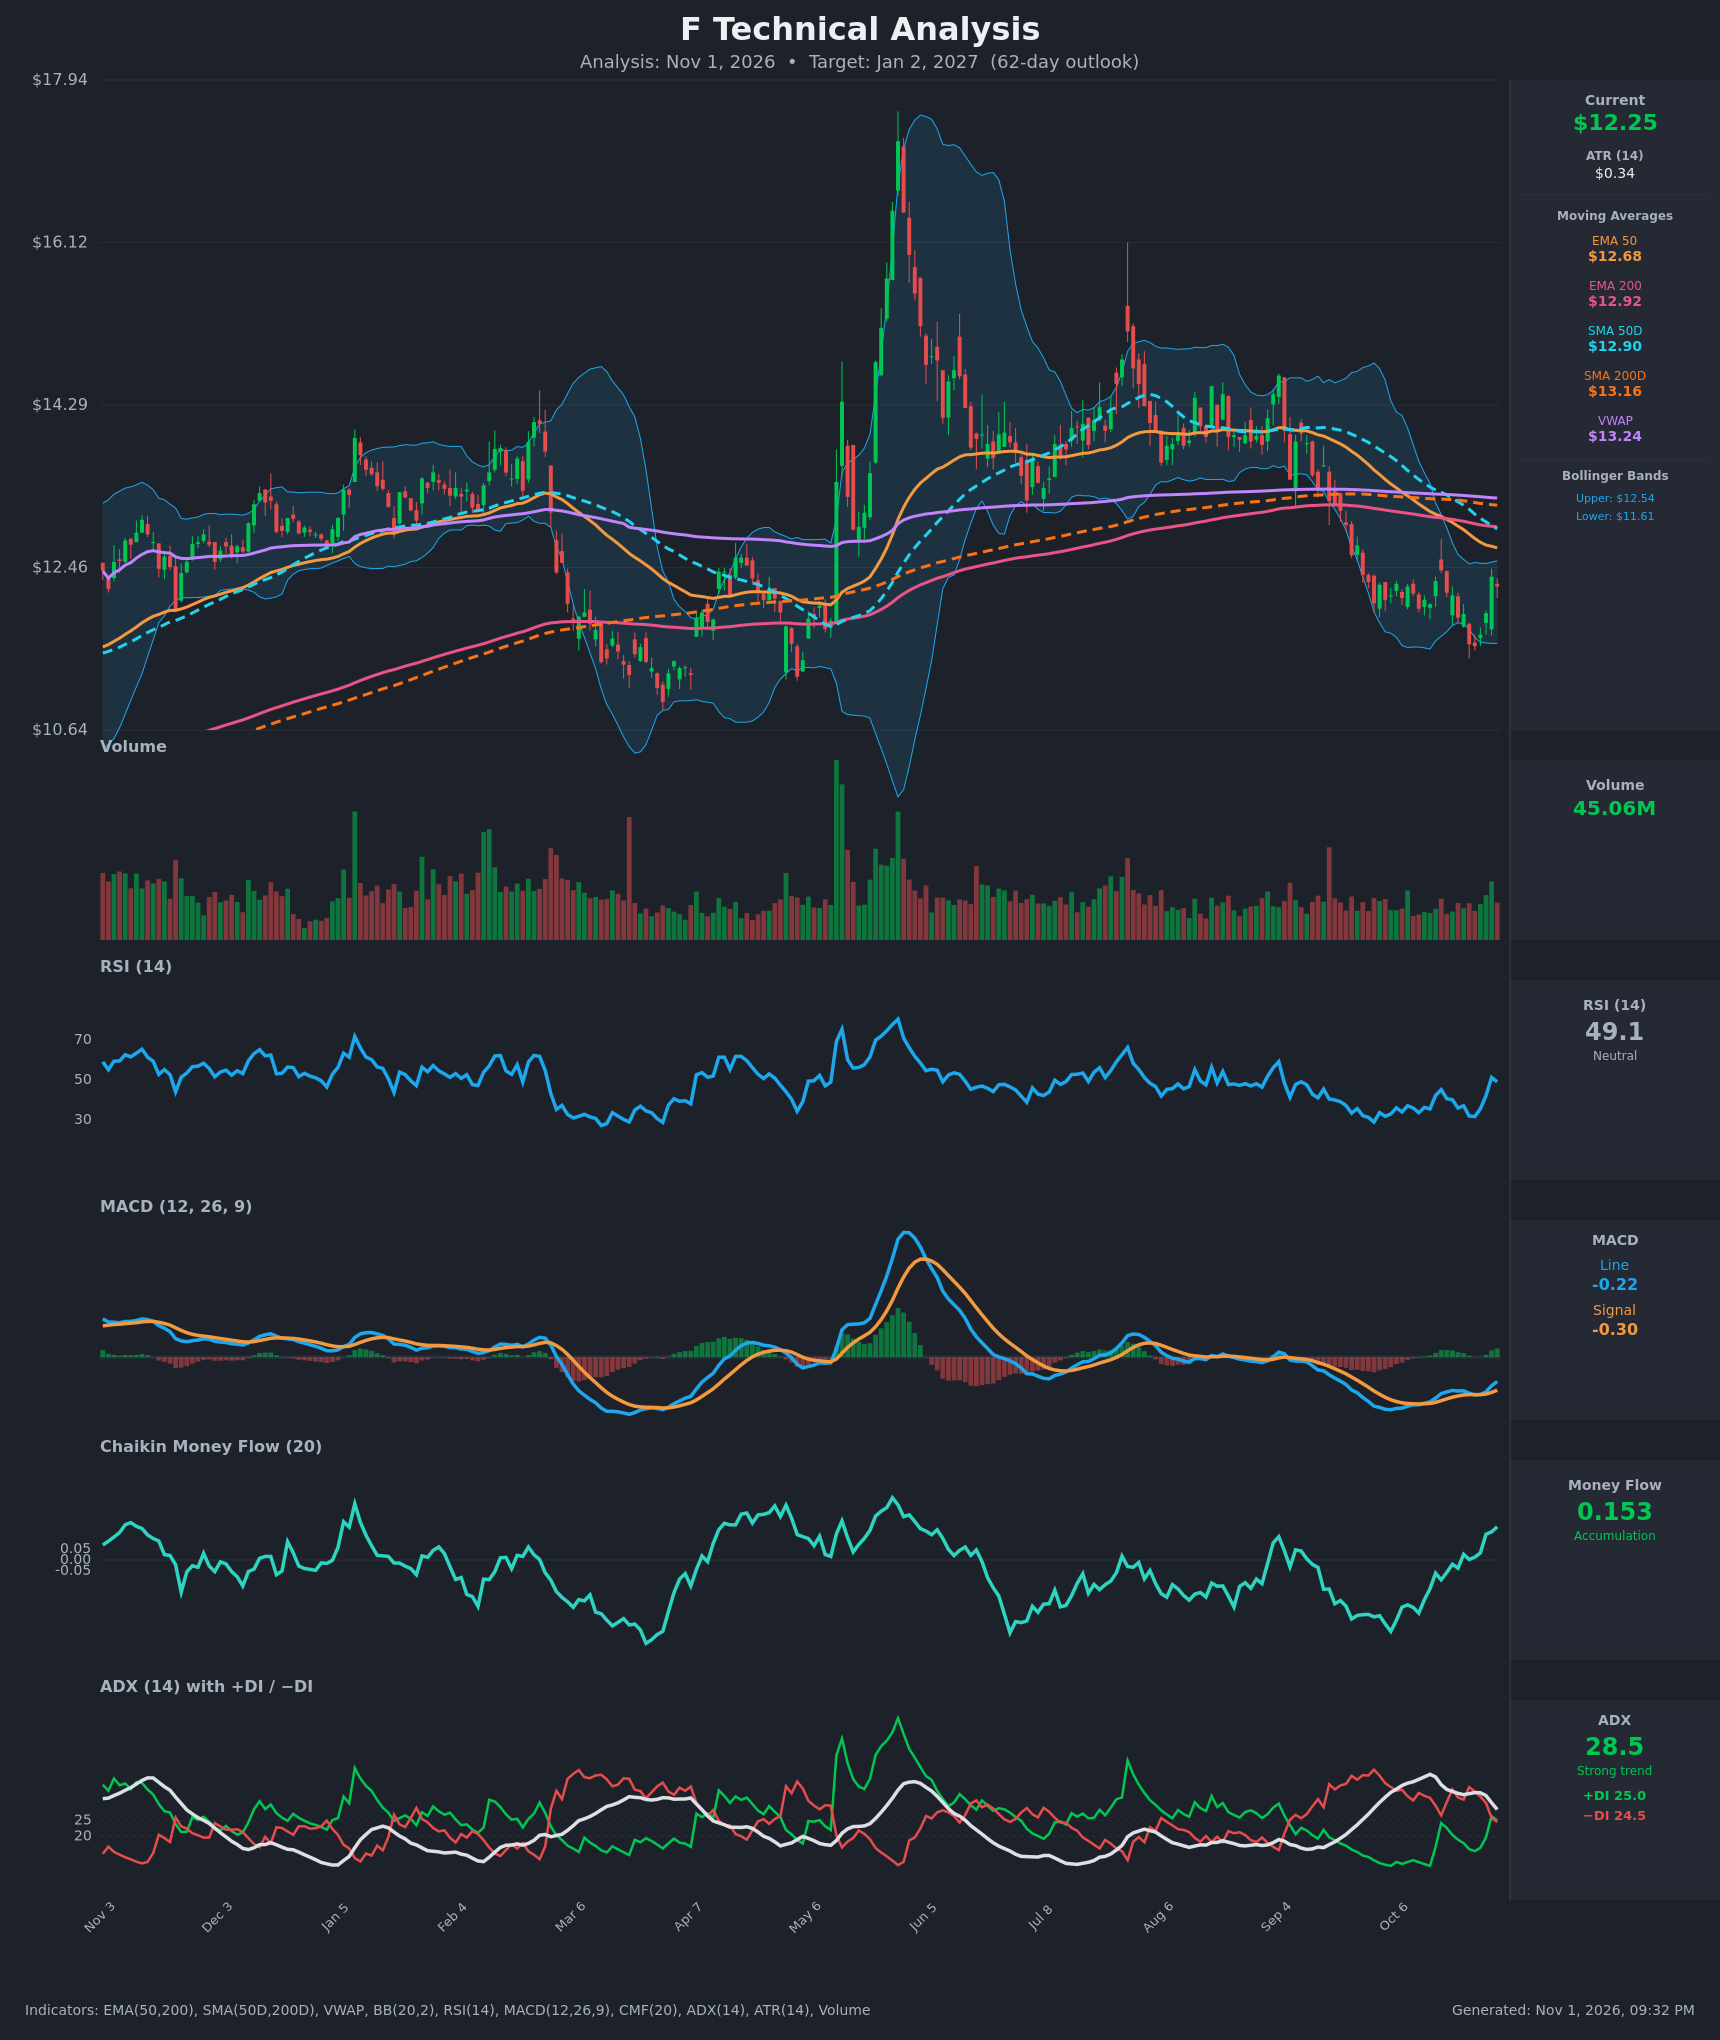
- RSI (14): 49.07, up from a 31.7 low on Oct 26 and back at the 50 midline. Momentum has shifted from oversold to neutral. The break above 50 on Oct 29 failed to hold, so a push back above 50 would confirm the recovery. [Neutral]
- 20 EMA: Not supplied. The 20-period Bollinger midline is about $12.07, and price at $12.25 sits above it as short-term support. The longer EMAs are overhead: EMA50 $12.68 and EMA200 $12.92. EMA50 is below EMA200, a bearish structure, and the gap is still widening. [Neutral]
- MACD: Line -0.223 is above signal -0.302, so a bullish crossover occurred around Oct 26-27. The histogram is positive (+0.08) and rising. Both lines are still below zero, so this is a recovery from a bearish phase rather than a confirmed uptrend. [Bullish]
- Bollinger Bands (20): Upper $12.54, lower $11.61, midline about $12.07. Price is in the upper half after bouncing off the lower band at the Oct 23-26 lows. The bands are fairly narrow, so volatility is compressed and a larger move is likely. [Bullish]
- CMF (20): +0.153, well above +0.05 and rising since the Oct 23 trough near zero. It has risen from -0.245 on Oct 12, showing clear accumulation during the bounce. This is the strongest bullish signal on the chart. [Accumulation]
- ADX (14): 28.5 and falling from 39.5, so the prior downtrend is losing strength. +DI (25.0) has just crossed above −DI (24.5), but the spread is tiny and the control is not decisive. [Weak Trend, fading bearish / early bullish shift]
- Volume: 45.06M on the latest bar, one of the heavier recent readings, on a green candle that rebounded from the lows. Rising volume on up days fits the CMF accumulation. [Mildly bullish]
DIVERGENCES & TRENDS
- Bullish divergence: Price made a lower low on Oct 23-26 (about $11.58), but the MACD line was at a similar level and has since turned up. RSI held around 31-32 rather than making a deeper low, and CMF turned positive at the lows. Momentum and money flow improved before price did.
- Crossovers: MACD turned bullish. +DI crossed above −DI on Oct 29-30. Price reclaimed the 20-period Bollinger midline.
- Bearish backdrop: Price is below every long-term average (EMA50, EMA200, SMA50D $12.90, SMA200D $13.16, VWAP $13.24). SMA50D is already below SMA200D (a death cross), and EMA50 is below EMA200. Price has made lower highs since the Aug-Sep peak near $14.5.
- ADX: Falling from 39.5 to 28.5, so the downtrend is exhausting.
- Resistance cluster: The moving averages are converging at $12.68-$13.24 and will likely cap rallies.
CHART PATTERNS
- Bullish Double Bottom (emerging): Lows at about $11.58-$11.60 (Oct 23-26) with a neckline near $12.40-$12.45 (the Oct 16 and Oct 29 highs). A close above the neckline gives a measured move of about $0.85 to roughly $13.25-$13.30. That target lines up with the SMA200D/VWAP zone.
- Pattern risk: The prior decline from $14.5 to $11.6 could form a bearish flag or descending channel, with lower highs capped by the falling EMA50. A rejection near $12.68-$12.90 would keep that bearish structure intact.
POTENTIAL SCENARIOS
- Scenario 1: Bullish Double Bottom Recovery to the MA Cluster — Accumulation and the MACD turn carry price through the $12.45 neckline and the EMA50, then up toward the SMA50D/EMA200 zone and possibly the SMA200D. Trigger: Daily close above $12.70 on solid volume. Target: $12.90-$13.25. Invalidation: Close below $11.90. (50% probability)
- Scenario 2: Bearish Rejection at Overhead Resistance — The rally stalls under the EMA50/EMA200 band, and the death-cross structure pulls price back to retest the October lows. Trigger: Rejection at $12.68-$12.90 followed by a close below $11.95. Target: $11.40-$11.60, with an extension to $11.00. Invalidation: Close above $13.00. (30% probability)
- Scenario 3: Neutral Range Chop — Price oscillates between $11.70 and $12.90 as ADX fades and the moving averages converge. Trigger: Repeated failures at the EMA50 with support holding at $11.60. Target: $12.10-$12.50. Invalidation: A decisive break outside the range. (20% probability)
PRICE TARGETS
- Target Price: $12.85 (62 days)
- Expected Range: $11.40 to $14.10 (width $2.70, about 22% of the current price, consistent with the 18-30% guidance for 61-180 days)
- Key Levels: Support at $11.58, Resistance at $12.68
OVERALL BIAS
OVERALL BIAS: BULLISH - A bullish MACD crossover, rising CMF (+0.153) and RSI recovery from near-oversold, together with a possible double bottom at $11.58 and fading ADX downtrend strength, favor a move toward the $12.90-$13.25 moving-average cluster. Conviction is modest because price is still below all major averages and overhead resistance is dense.
This is educational analysis and not financial advice.