IBM 62-day bullish forecast — Nov 1, 2026
- Bias: Bullish
- Timeframe: 62 days (made Nov 1, 2026, target date Jan 1, 2027)
- Price at analysis: $257.81
- Price target: $272.00
- Expected range: $232.00 – $288.00
- Result: Pending — graded after the close on Jan 1, 2027
Get a free AI analysis of IBM today
Analysis
TECHNICAL INDICATORS
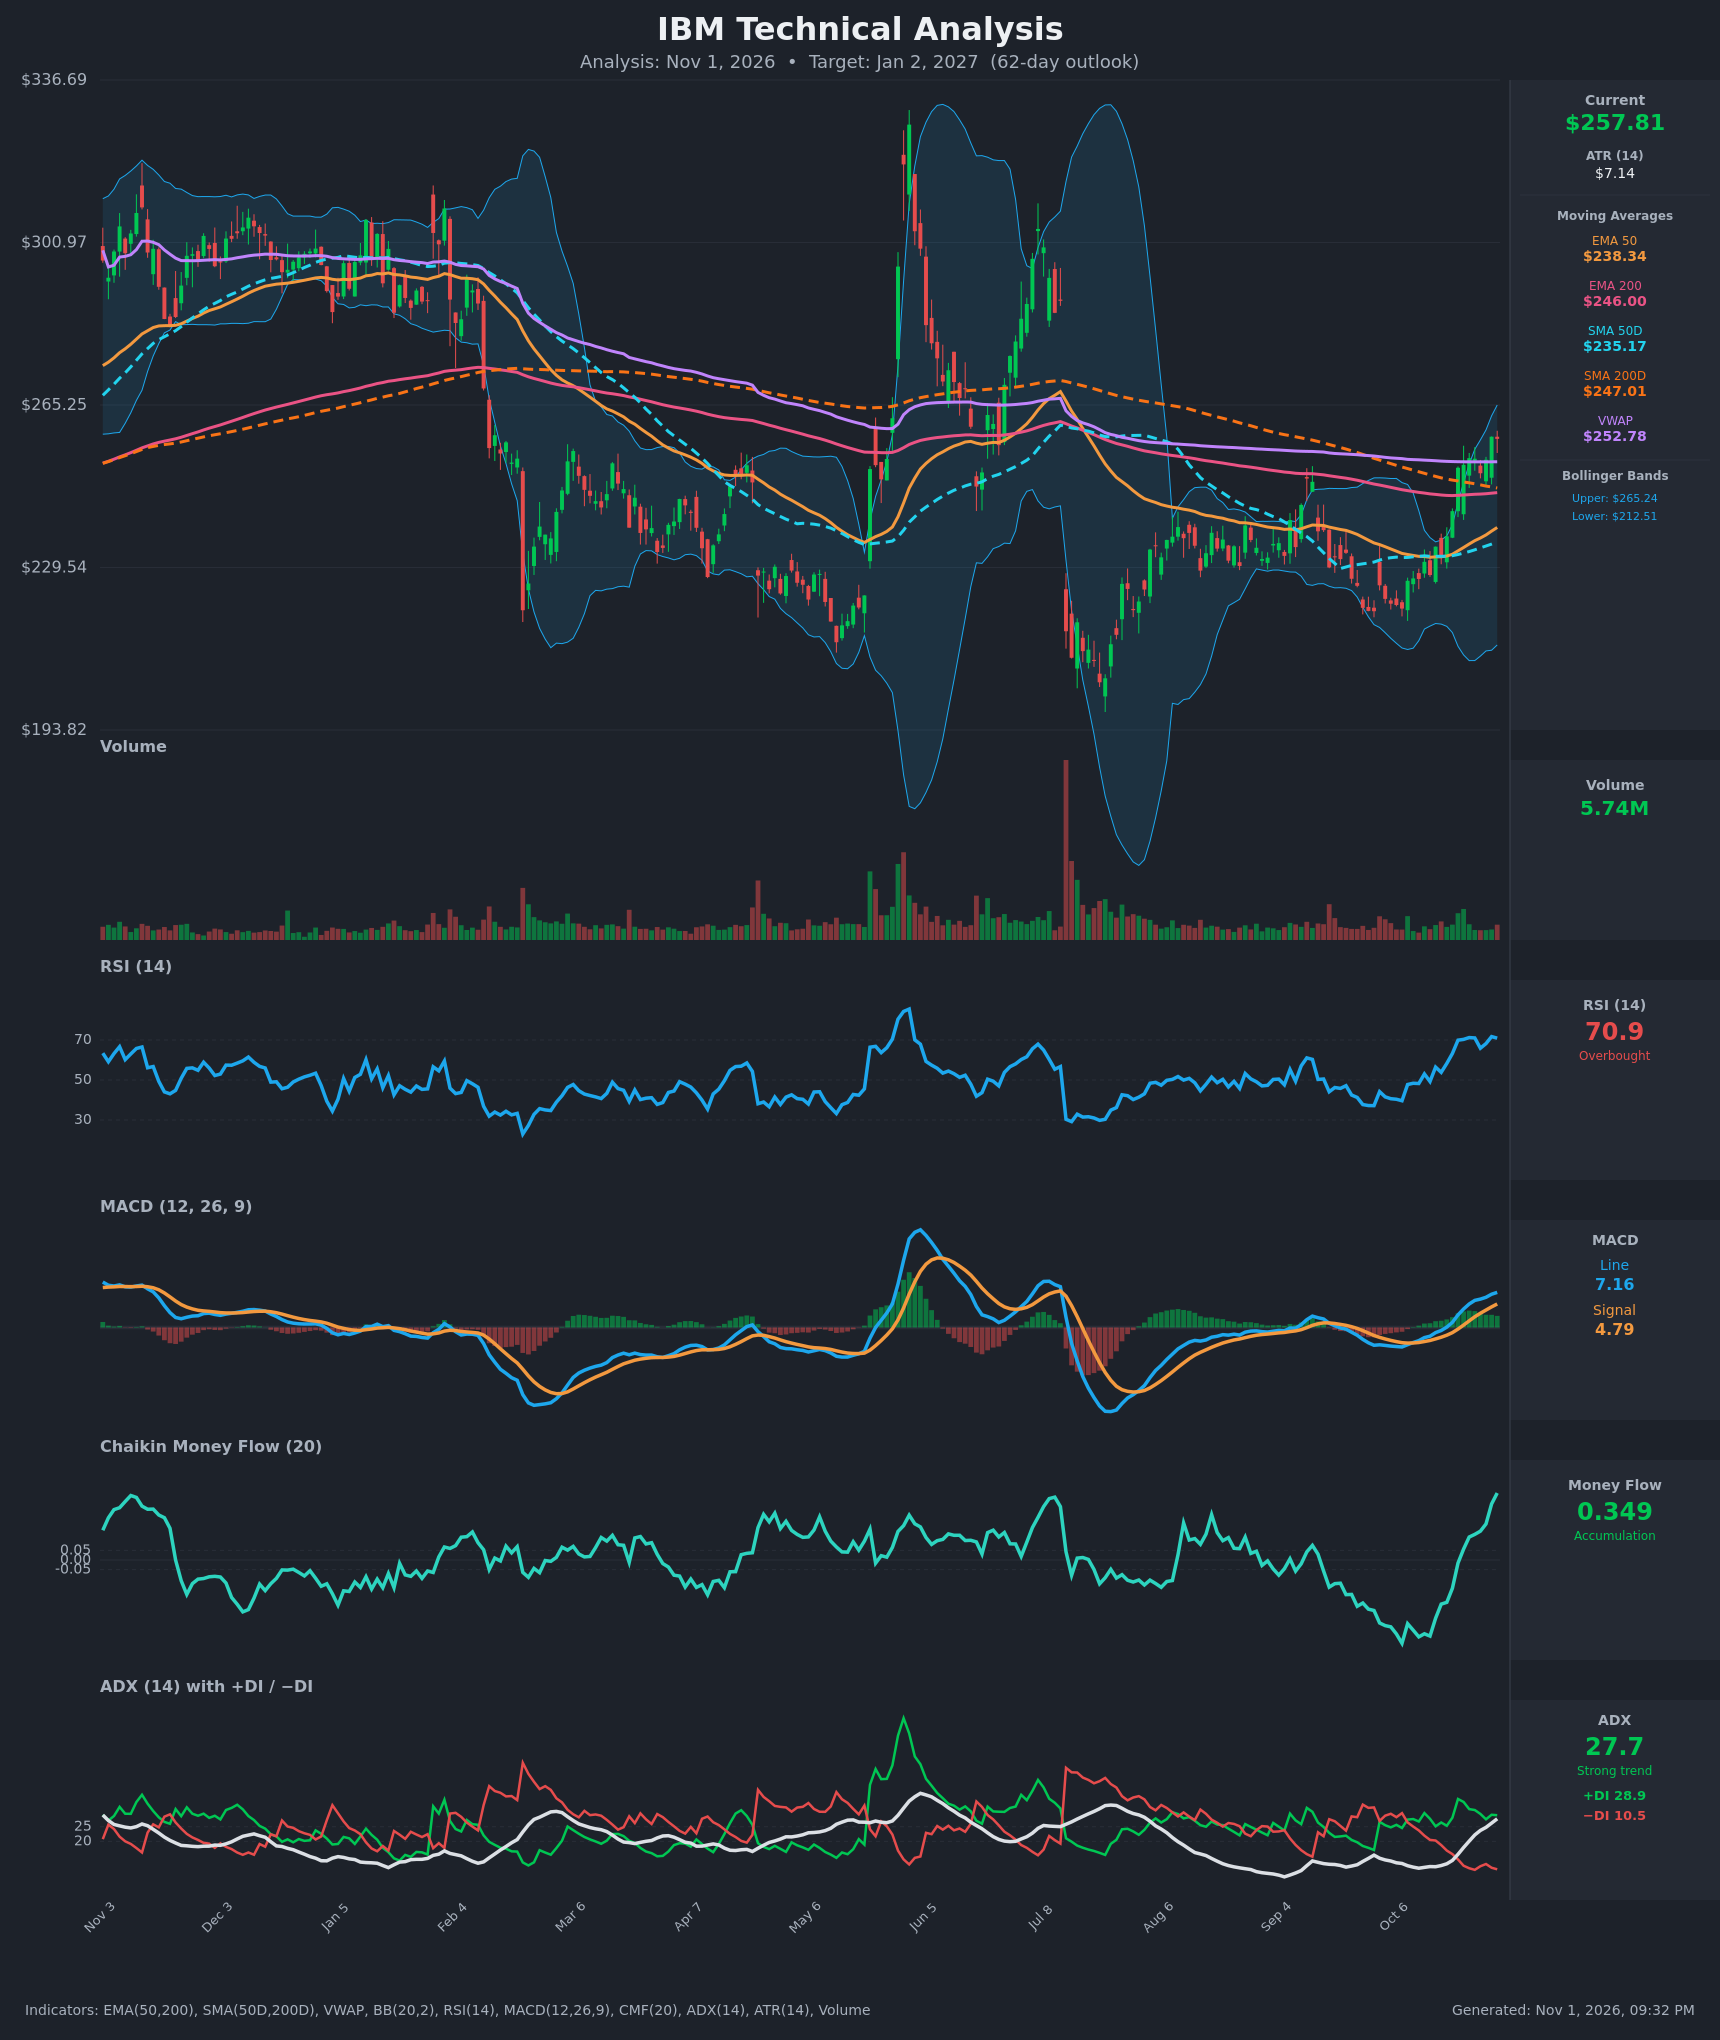
- RSI (14): 70.92, just into overbought territory. It climbed from 48 on Oct 12 to above 70 within about 8 sessions, so momentum is strong, but near-term stretch raises the odds of a pause or pullback. Overbought readings in a new trend with ADX rising can persist. [Bullish]
- 20 EMA: No 20 EMA value was supplied. The nearest proxy is the EMA 50 at $238.34, which is rising, with price about 8% above it. Price has also reclaimed the EMA 200 ($246.00), the SMA 200D ($247.01) and VWAP ($252.78). The EMA 50 is still below the EMA 200 (gap about $7.7 and narrowing), so there is no bullish EMA cross yet. [Bullish]
- MACD: Line 7.16 is above Signal 4.79, and the bullish cross happened around Oct 19–20 (Oct 19 line 0.071 vs signal -1.574). The line is now well above zero, the histogram is positive and widening, and the line is at its highest reading since the early-summer spike. [Bullish]
- Bollinger Bands (20): Price at $257.81 sits in the upper part of the band ($212.51 to $265.24), roughly 85% of the way up. The bands are fairly wide after the prior volatility, and price is approaching the upper band, which is the nearest overhead test. A close above $265 would be a band walk. Failure there would invite mean reversion toward the midline (~$239). [Bullish]
- CMF (20): 0.349, strongly positive and the highest on the chart. It swung from -0.40 on Oct 12 to +0.35, which shows heavy accumulation behind the breakout. [Accumulation]
- ADX (14): 27.7 and rising (from 10.8 on Oct 12). +DI 28.9 is far above −DI 10.5, so bulls are in control. A trend has just started, and the rising ADX confirms it. [Strong Trend – Bullish]
- Volume: 5.74M, moderate and below the large spikes seen at earlier breakouts and gaps. The recent green candles show slightly improved volume, so the breakout is supported by CMF but not yet by a surge in raw volume. [Mildly Supportive]
DIVERGENCES & TRENDS
- No bearish divergence yet: RSI at 70.9 is not making lower highs against rising price. MACD and CMF are both making new highs alongside price.
- RSI plateau: RSI has stalled at 70–71.7 for about a week while price chops between $250 and $258. That is mild consolidation at overbought levels, so watch for a lower RSI high if price pushes up.
- Moving-average structure: Price has reclaimed the 200-day averages (EMA 200 $246.00, SMA 200D $247.01), which is the key long-term break. The SMA 50D ($235.17) is still below the SMA 200D ($247.01), so the death cross from earlier this year is still in place. The gap has narrowed from about $13 to $12 and keeps closing, so a golden cross is possible within the 62-day window if price holds.
- Trend shift: +DI crossed above −DI in mid-Oct and the gap has widened since. ADX has crossed above 25, confirming a trend change from the range of Aug–Oct.
- Resistance zone: Price is stalling just under the upper band and the $265 area, where the Jul–Aug breakdown originated.
CHART PATTERNS
- Bullish Double Bottom / broad base (loose fit): Lows near $207 in Jul–Aug and about $218–225 in Oct form a higher-low base, and the Aug–Oct range of $225–$250 has broken to the upside. The classic measured move from the base (roughly $20–$25 above the breakout around $250) points to about $270–$275.
- Range breakout (consolidation resolving upward): Price emerged from a tight, low-volatility consolidation above the declining SMA 200D, supported by CMF and ADX. This is similar to the continuation/reversal setups in the reference diagram that resolve upward.
- Overhead resistance: The prior supply zone sits at about $265–$270 (the Jul/Aug highs and the declining 200-day average region), with further supply near $280–$300 from earlier in the year.
POTENTIAL SCENARIOS
- Scenario 1: Bullish Breakout Continuation — Price digests the overbought RSI with a shallow dip toward VWAP, then breaks above the upper Bollinger Band and the $265 resistance, helped by strong accumulation and a golden cross approaching. Trigger: daily close above $265.25 on rising volume. Target: $272–$285. Invalidation: daily close below $246 (EMA/SMA 200 area). (50% probability)
- Scenario 2: Bearish Overbought Reversal / Failed Breakout — RSI rolls over at the upper band and price fails at $265, falling back below VWAP and into the 200-day moving averages, which turns the move into a bull trap. Trigger: close below $252.78, then below $246. Target: $238–$246 (EMA 50 / SMA 50D area). Invalidation: reclaim of $265 on strong volume. (30% probability)
- Scenario 3: Neutral Consolidation — Price chops between the 200-day averages (~$247) and the upper band (~$265) while momentum cools. Trigger: ADX rolling over below 25 with overlapping candles. Target: $245–$265 range. Invalidation: close outside the $245–$266 range. (20% probability)
PRICE TARGETS
- Target Price: $272.00 (62 days, Jan 2, 2027)
- Expected Range: $232.00 to $288.00 (width $56 = about 21.7% of current price, consistent with the 18–30% guidance for 61–180 days)
- Key Levels: Support at $252.78 (VWAP), with deeper support at $246–$247 (EMA/SMA 200). Resistance at $265.24 (upper Bollinger Band), then $280.
OVERALL BIAS
OVERALL BIAS: BULLISH - Price has reclaimed all the key long-term averages, MACD is above zero and widening, CMF is strongly positive at 0.349, and ADX of 27.7 with +DI far above −DI confirms a new uptrend. The main risk is the overbought RSI (70.9) and the upper Bollinger Band/$265 resistance, which may cause a pullback first.
This is educational analysis and not financial advice.