MSFT 62-day bullish forecast — Nov 1, 2026
- Bias: Bullish
- Timeframe: 62 days (made Nov 1, 2026, target date Jan 1, 2027)
- Price at analysis: $521.91
- Price target: $537.00
- Expected range: $475.00 – $575.00
- Result: Pending — graded after the close on Jan 1, 2027
Get a free AI analysis of MSFT today
Analysis
TECHNICAL INDICATORS
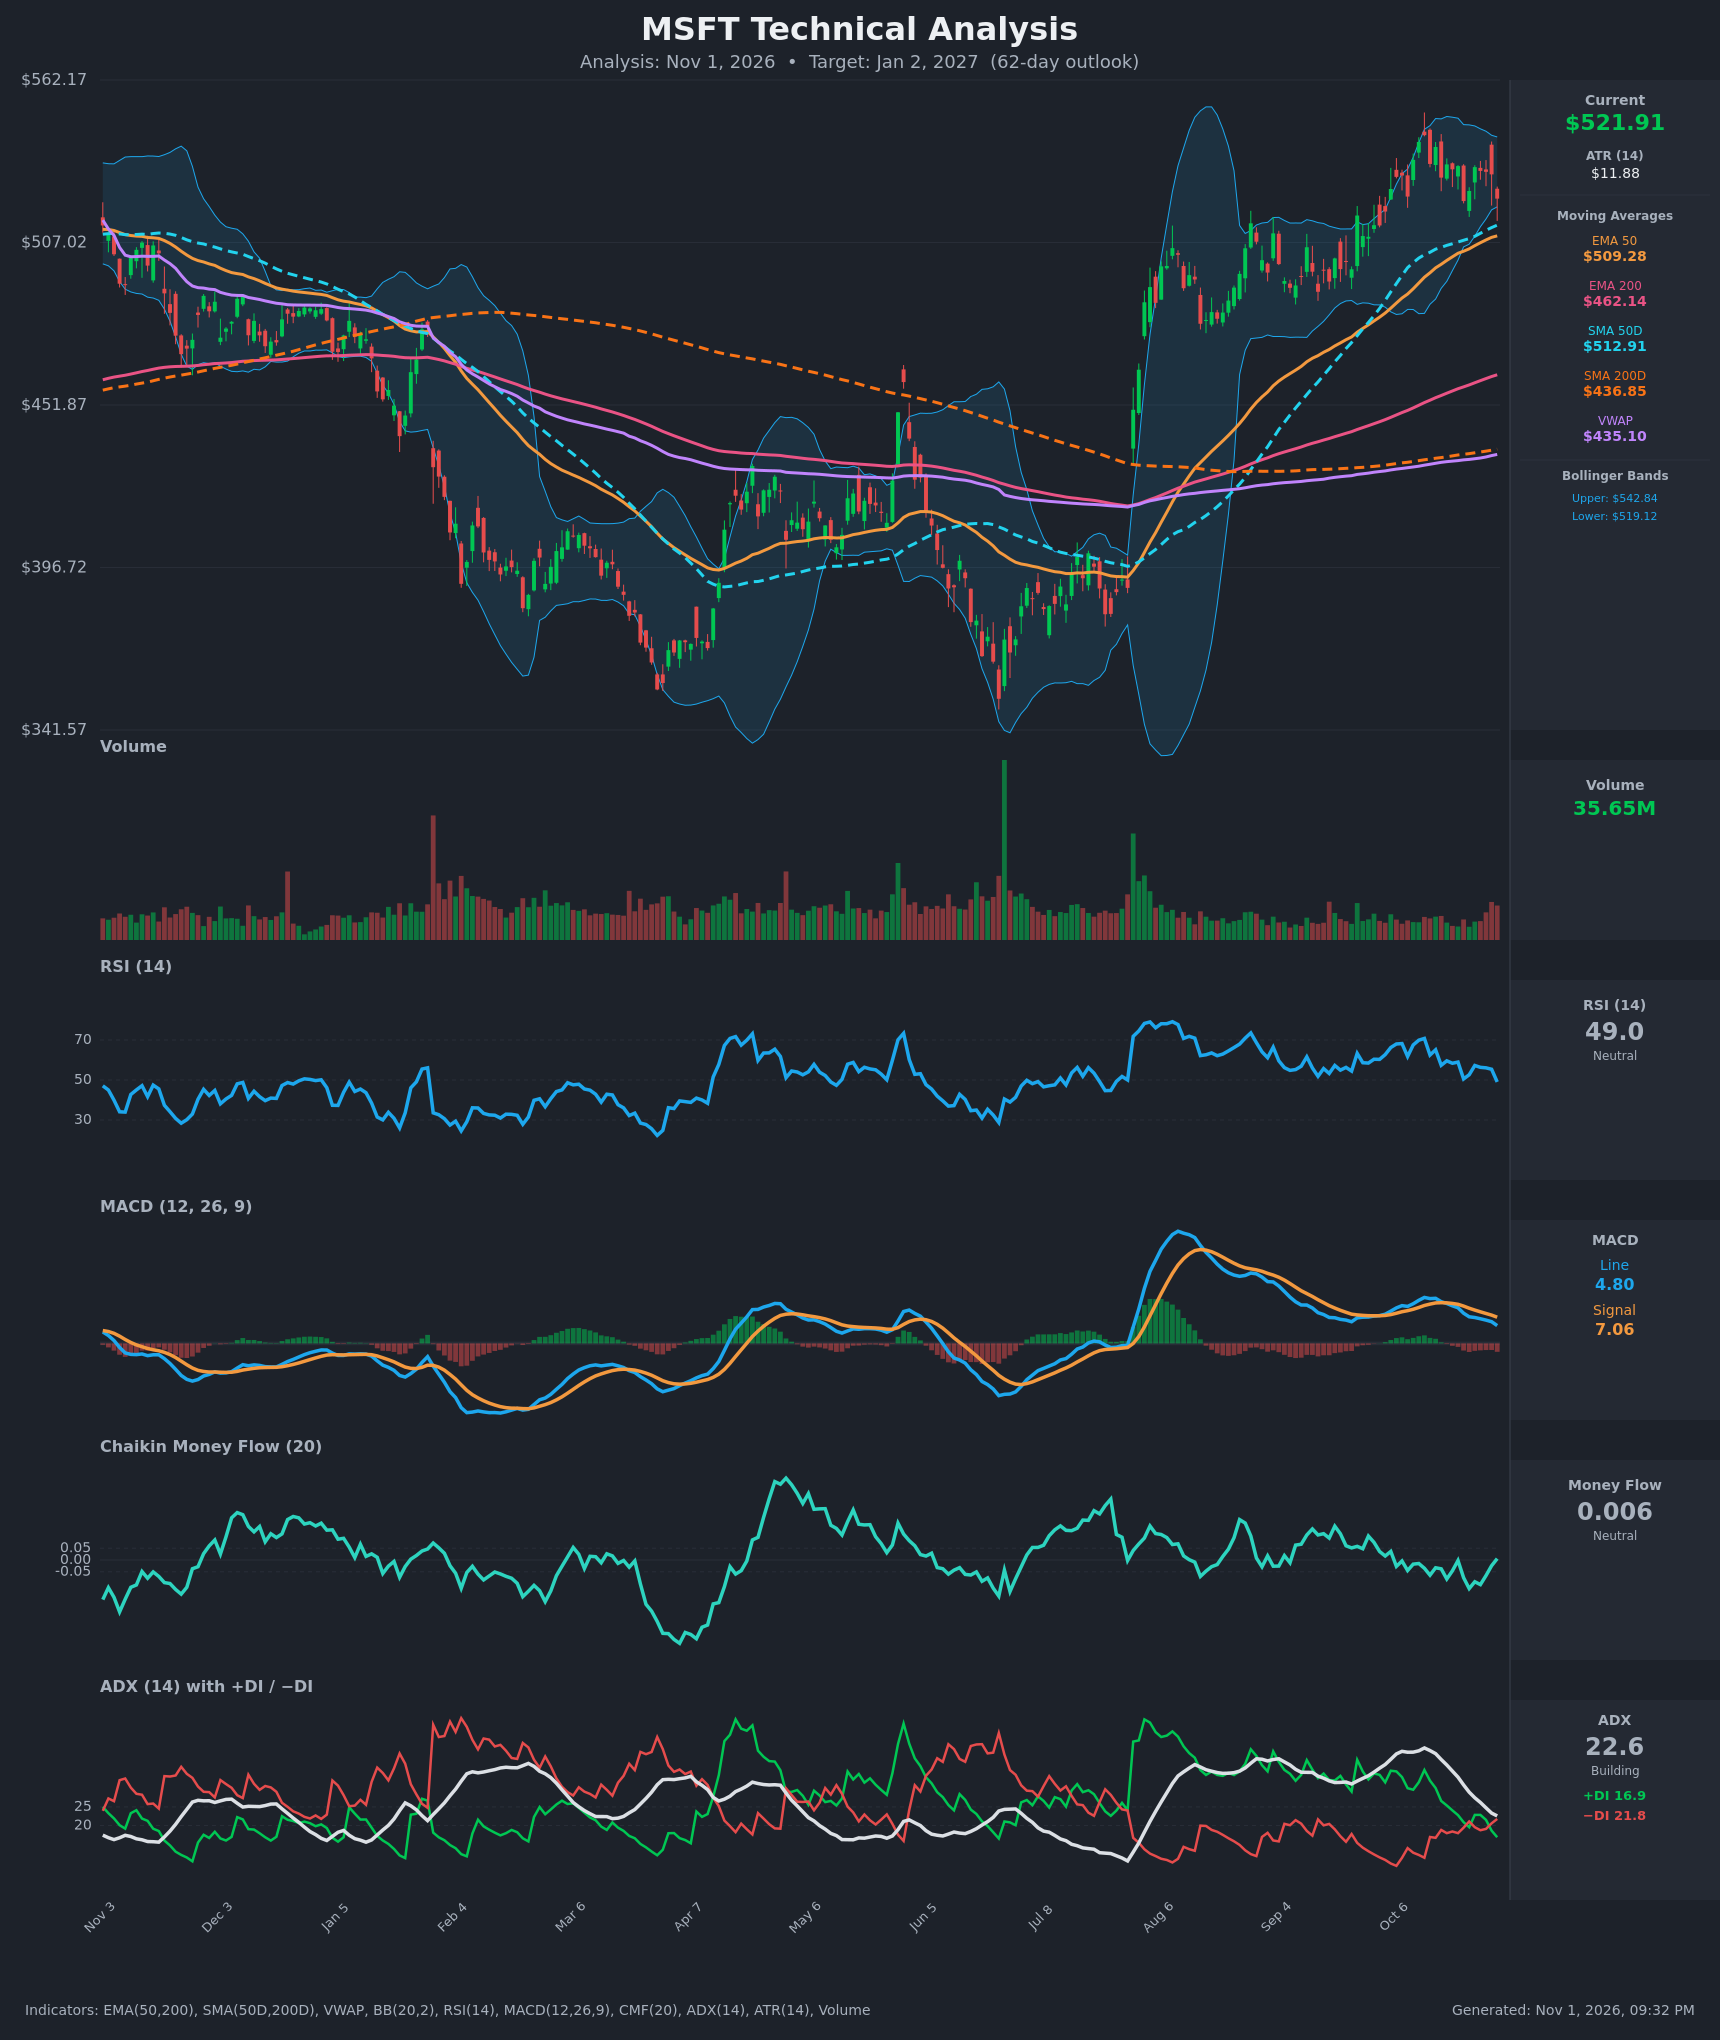
- RSI (14): 49.03, down from about 70 on Oct 12-13 and now at the neutral midline. Momentum has cooled quickly, but RSI is not oversold and has held above 40 on the chart since August. [Neutral]
- 20 EMA: No 20 EMA value was supplied. The 50 EMA is $509.28 and rising, about 2.4% below price, and it is the nearest dynamic support. The SMA50D at $512.91 sits just above it. Price is holding above both after a 3-week pullback from the highs. [Neutral]
- MACD: Line 4.80 is below Signal 7.06, so the bearish crossover happened around Oct 19. The line has fallen from 12.4 and the histogram is negative and widening. Momentum is fading, though the line is still above zero. [Bearish]
- Bollinger Bands (20): Upper $542.84, lower $519.12. Price at $521.91 is hugging the lower band after being rejected near the upper band, and the bands are moderately narrow. A pullback to the lower band in an uptrend often leads to a bounce toward the midline (about $531). A close below $519 would signal further downside. [Neutral]
- CMF (20): 0.006, inside the ±0.05 neutral zone. It was negative (-0.02 to -0.12) for most of October and has only just ticked back to zero. There is no clear accumulation, and the selling pressure of the last few weeks is easing. [Neutral]
- ADX (14): 22.6 and falling from 40.8, so the trend has weakened into the transition zone. −DI (21.8) is now above +DI (16.9), a mild bearish tilt. The strong uptrend of Aug-Oct has faded into consolidation. [Weak Trend, slight bearish bias]
- Volume: 35.65M, modest, with no distribution spikes in the recent decline. Volume has been light and fairly balanced on the pullback. The largest bar of the year was the August breakout gap, which is a constructive anchor for the higher base. [Neutral]
DIVERGENCES & TRENDS
- Long-term structure: Price is well above SMA200D ($436.85) and EMA200 ($462.14). The golden cross (SMA50D over SMA200D) and the EMA50/EMA200 bullish alignment are intact, and all the long-term averages are rising.
- Short-term momentum: The MACD bearish crossover, the RSI drop from 70 to 49, and −DI crossing above +DI all show a corrective phase. ADX falling from 40 to 22 signals trend exhaustion and consolidation, not a confirmed reversal.
- Divergence: Price made a slightly lower high in late October against the mid-October peak, and MACD made a clear lower high. This is mild bearish divergence and fits a pullback or range, not a new impulse.
- Price vs VWAP: Price is about 20% above VWAP ($435.10), which is stretched and favours mean reversion toward the rising MAs.
- Crossover watch: The SMA50D ($512.91) is now above the EMA50 ($509.28), and price is only about 1.7% above the SMA50D cluster. A break below $509 would be the first real damage to the trend.
CHART PATTERNS
- Bullish Flag / Symmetrical consolidation (continuation): After the August surge from about $400 to the $540s, price has formed a series of lower highs and a shallow pullback on declining volume. If $509-$513 holds, this is a continuation setup. The measured move from the flag implies a retest of $545-$555 and possibly higher.
- Bearish Double Top risk (reversal): The mid-October high near $543-$555 and the lower high that followed form a possible double top, with a neckline around $519-$521. A close below the neckline would target roughly $490-$495. Price is sitting on that neckline now, so this is the key test.
- The evidence is balanced between these two patterns, but the larger uptrend and the rising MAs favour the continuation read with modest conviction.
POTENTIAL SCENARIOS
- Scenario 1: Bullish Pullback Holds and Trend Resumes — Price finds support at the rising 50-day cluster ($509-$513), MACD turns back up, and price retakes the BB midline and then the upper band. Trigger: daily close above $533 with RSI back above 55. Target: $545-$560. Invalidation: daily close below $505. (45% probability)
- Scenario 2: Bearish Double Top Breakdown — The $519-$521 neckline fails, the MACD and −DI weakness extends, and price drops through the 50-day cluster toward the gap-fill zone. Trigger: daily close below $509 on rising volume. Target: $470-$490. Invalidation: reclaim of $535. (35% probability)
- Scenario 3: Neutral Range Consolidation — Price chops between $505 and $545 for most of the period as ADX stays below 25. Trigger: repeated failures at both $543 and $509. Target: $515-$530. Invalidation: close outside the $505-$545 range. (20% probability)
PRICE TARGETS
Timeframe: 62 days (target date about Jan 2, 2027). Range width check: $575 − $475 = $100, which is 19.2% of $521.91. That is within the 18-30% guidance for 61-180 days.
- Target Price: $537.00
- Expected Range: $475.00 to $575.00
- Key Levels: Support at $509.28, Resistance at $542.84
OVERALL BIAS
OVERALL BIAS: BULLISH - Price remains above all rising long-term averages (golden cross intact) and is pulling back into the $509-$513 support cluster. The MACD, ADX and −DI weakness is consistent with a correction within an uptrend, so the evidence modestly favours a resumption toward the $537 area. A close below $509 would flip the bias.
This is educational analysis and not financial advice.