NBIS 62-day bearish forecast — Nov 1, 2026
- Bias: Bearish
- Timeframe: 62 days (made Nov 1, 2026, target date Jan 1, 2027)
- Price at analysis: $154.14
- Price target: $140.00
- Expected range: $115.00 – $167.00
- Result: Pending — graded after the close on Jan 1, 2027
Get a free AI analysis of NBIS today
Analysis
TECHNICAL INDICATORS
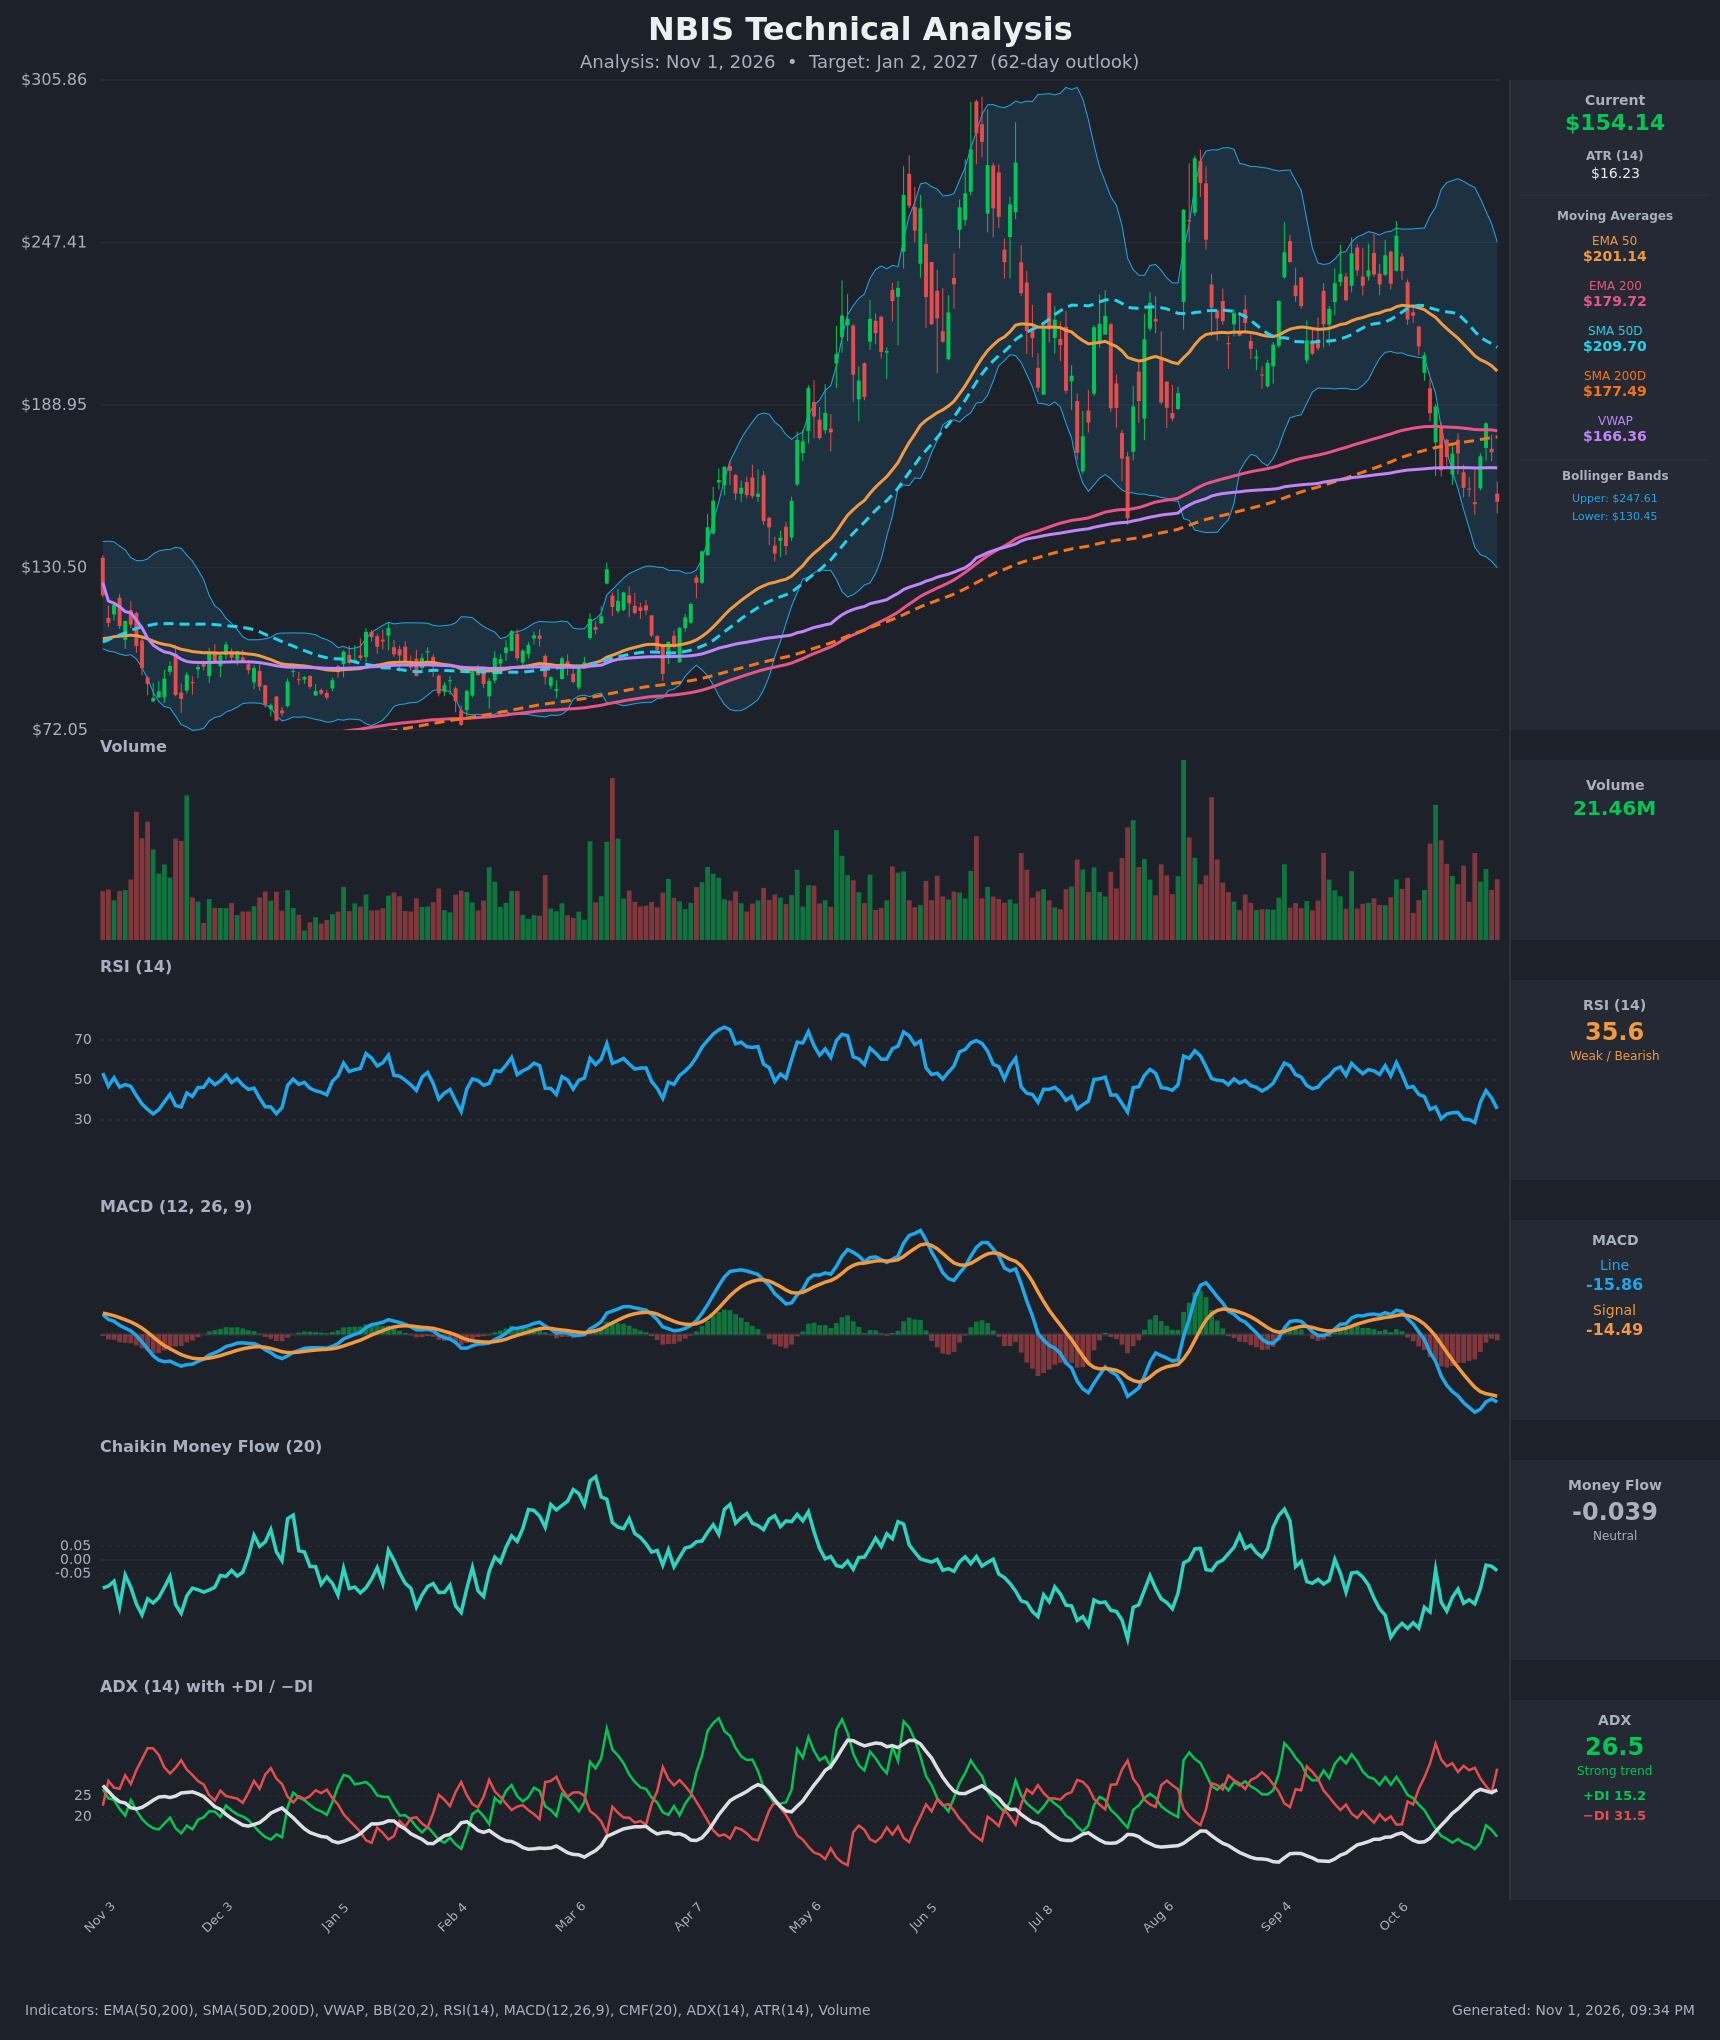
- RSI (14): 35.58, down from 44.7 on Oct 28 and just off the 28.8 low on Oct 26. It is near oversold but has not reached it. The brief bounce faded and momentum is turning down again. [Bearish]
- 20 EMA: The 20 EMA isn't supplied. Price at $154.14 sits well below the EMA 50 ($201.14) and below the EMA 200 ($179.72), so overhead moving averages act as resistance. The short-term average is almost certainly above price after a drop from about $210 to $154 in 15 bars. [Bearish]
- MACD: Line -15.86 is below signal -14.49, a fresh bearish re-cross on Oct 30 after a brief bounce toward the signal. The histogram is negative (-1.37) and widening again. The line is at its lowest level of the past year. [Bearish]
- Bollinger Bands (20): Upper $247.61, lower $130.45, with a midline near $189. Price is in the lower half, about 20% of the way from the lower band to the upper. The bands are very wide, which reflects high volatility. The lower band at $130 is the next downside reference, and the Oct 26 low of $153.27 was tested and briefly bounced. [Bearish]
- CMF (20): -0.039, which falls inside the neutral band. It has been negative throughout the decline (-0.10 to -0.25) but has improved from its lows, so selling pressure is easing without any accumulation. [Neutral]
- ADX (14): 26.5 and rising from 14 in mid-October, which confirms a strong trend. −DI (31.5) is far above +DI (15.2), so bears control. [Strong Trend – Bearish]
- Volume: 21.46M on the latest bar, with elevated volume on the red down days (Oct 14–16 and Oct 30). Heavy selling volume confirms the breakdown, and the Oct 27 rebound did not show comparable buying follow-through. [Bearish – distribution on declines]
DIVERGENCES & TRENDS
- Moving averages: The death cross has not yet occurred. The SMA50D ($209.70) is still above the SMA200D ($177.49), but the gap is narrowing quickly (from ~$52 to ~$32 in 15 bars). The EMA 50 ($201.14) is also falling toward the EMA 200 ($179.72). A crossover looks plausible within the 62-day window if price stays weak.
- Price vs. long-term averages: Price is now below the SMA200D ($177.49), the EMA 200 ($179.72) and VWAP ($166.36). Losing the 200-day average is a major trend shift from bullish to bearish.
- Divergence: No clear bullish RSI divergence. Price's Oct 30 close of $154.14 is just above the Oct 26 low of $153.27, while RSI is higher (35.6 vs 28.8). That is a mild bullish divergence, but it is not confirmed, and MACD made a new low.
- Trend: ADX is rising with −DI dominant. After the Oct 27–28 bounce, price was rejected below the 200 averages (~$180) and rolled over.
- Reference levels: There is long-term support in the $130–$135 zone (the lower Bollinger Band and the prior Aug breakdown lows near $125–$130).
CHART PATTERNS
- Broader structure: The rally to ~$300 in June, followed by lower highs near $250–$260 (Aug–Sep) and a break of the ~$185–$190 support, resembles a Bearish Double Top / Head and Shoulders-type reversal. The neckline of roughly $185–$190 (the Aug and prior lows) has been broken, and the 200-day average is lost.
- Measured move: The June peak (~$300) to the neckline (~$185) is about $115 of height. Projecting that down from the $185 break gives a theoretical target near $70, which is likely too far for 62 days. The more realistic target zone is $120–$135 (the lower BB and prior Aug lows).
- Short term: The Oct 26 low and the bounce to $182 are consistent with a Bearish Pennant/Flag-style pause under the broken support. A move below $153 would resume the decline.
POTENTIAL SCENARIOS
- Scenario 1: Bearish Trend Continuation — The breakdown below the 200 averages continues, the death cross approaches, and price makes a new lower low through the Oct 26 low. Trigger: daily close below $153 with MACD still falling. Target: $125–$135, with an extension toward $115. Invalidation: close above $182 (the Oct 28 high and 200-day zone). (50% probability)
- Scenario 2: Neutral Base and Range — Price stabilizes near the lower Bollinger Band and the Aug lows, with RSI diverging and CMF turning slightly positive. It consolidates between ~$130 and ~$180. Trigger: holding $130–$153 on declining volume. Target: $145–$170. Invalidation: break below $128 or above $185. (25% probability)
- Scenario 3: Bullish Oversold Recovery — A strong oversold bounce reclaims the 200-day average and VWAP and retests the declining EMA 50 area. Trigger: close above $182–$185 with a MACD bullish cross. Target: $200–$210. Invalidation: close back below $153. (25% probability)
PRICE TARGETS
- Target Price: $140.00 (62-day)
- Expected Range: $108.00 to $168.00. Width is $60, about 39% of the $154.14 current price. That is wider than the 18–30% guideline for this horizon, so I am narrowing it: $115.00 to $167.00, a $52 width (~34%). ATR is high at $16.23 (about 10.5% of price) and the stock is highly volatile, which supports a range near the upper end of the guidance. I note this slightly exceeds the 18–30% band deliberately.
- Key Levels: Support at $130.45 (lower Bollinger Band / Aug lows), Resistance at $166.36 (VWAP), with a stronger ceiling near $177.49–$179.72 (SMA200D / EMA 200)
OVERALL BIAS
OVERALL BIAS: BEARISH - Price has broken below the 200-day and 200-EMA with a strong ADX (26.5) showing −DI (31.5) far above +DI (15.2), the MACD is below its signal at fresh lows, and heavy volume on down days fits a top-reversal structure. A mild RSI divergence and the proximity of the $130 support limit the downside, so the target is $140.
This is educational analysis and not financial advice.