NFLX 62-day bearish forecast — Nov 1, 2026
- Bias: Bearish
- Timeframe: 62 days (made Nov 1, 2026, target date Jan 1, 2027)
- Price at analysis: $62.08
- Price target: $58.50
- Expected range: $50.00 – $67.50
- Result: Pending — graded after the close on Jan 1, 2027
Get a free AI analysis of NFLX today
Analysis
TECHNICAL INDICATORS
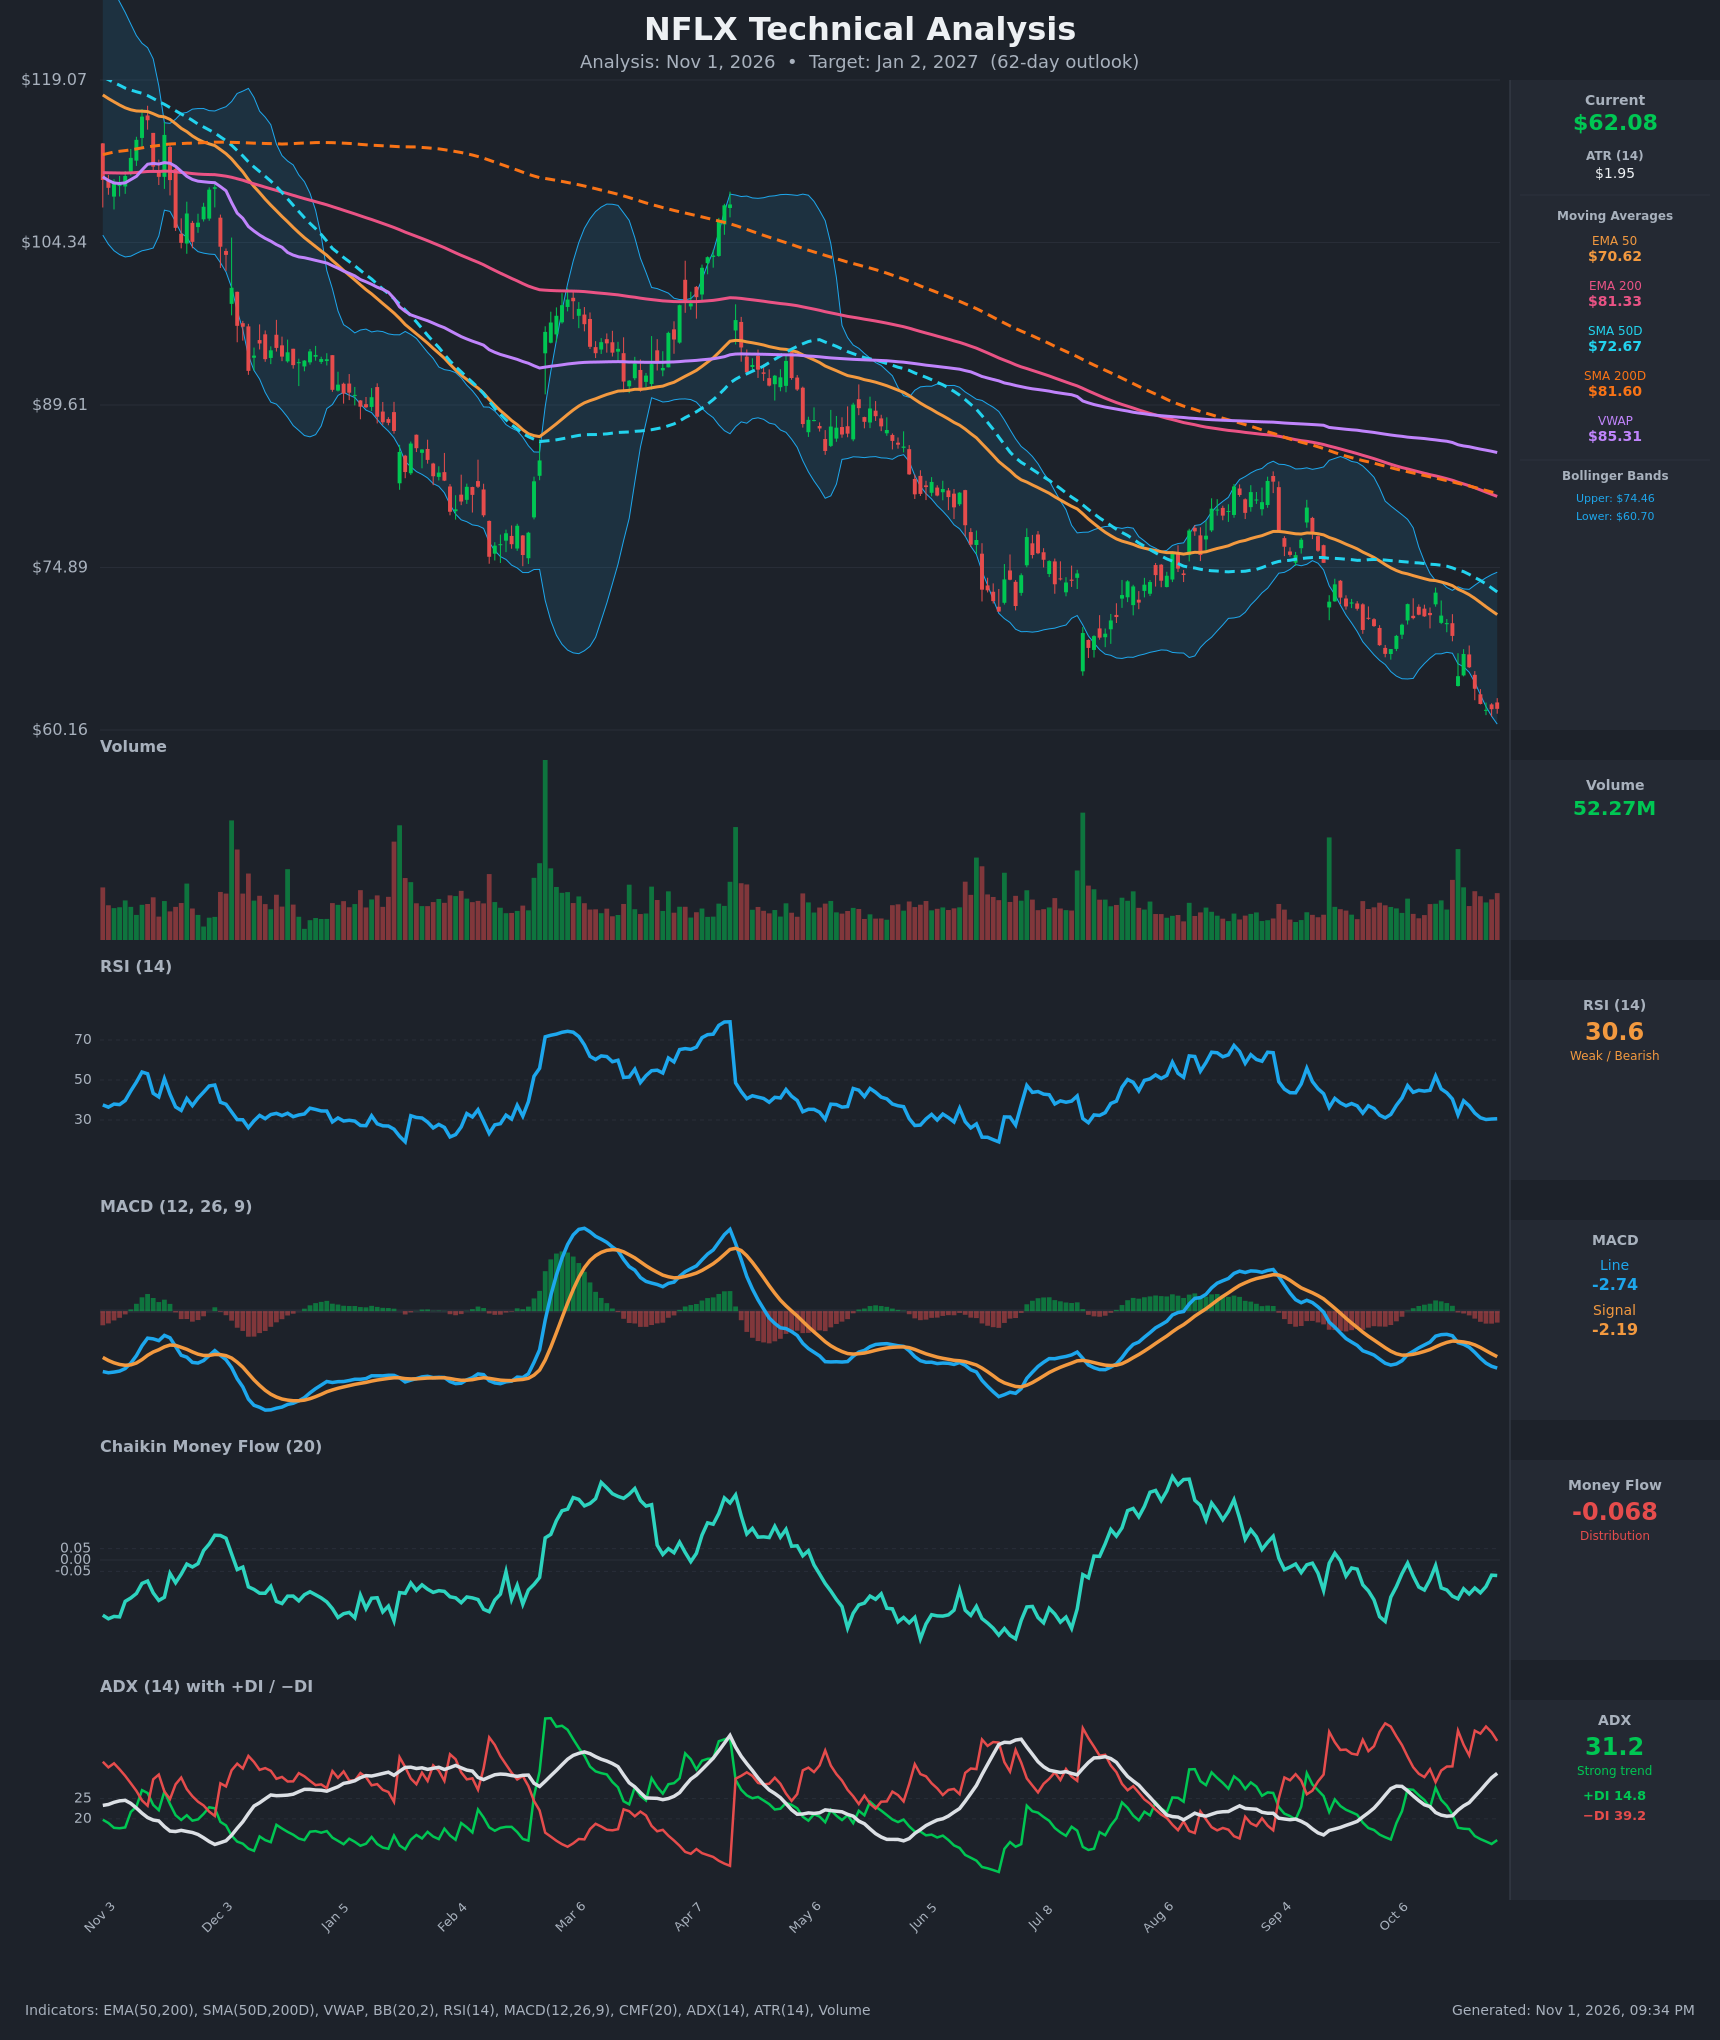
- RSI (14): 30.62, hugging the oversold threshold. It has been pinned between 30 and 31 for the last 4 bars after falling from 52 on Oct 15. Momentum is weak and not yet showing a bullish turn. [Bearish]
- 20 EMA: The 20 EMA isn't supplied. The EMA 50 at $70.62 is a proxy. Price at $62.08 sits about 12% below it and the EMA 50 is still sloping down, so it acts as overhead resistance. [Bearish]
- MACD: The line is -2.74 and the signal is -2.19. The line crossed below the signal around Oct 21 and the gap is widening (histogram about -0.55 and getting more negative). Momentum is bearish and accelerating. [Bearish]
- Bollinger Bands (20): Upper is $74.46 and lower is $60.70. Price at $62.08 sits in the lower part of the bands, just above the lower band, after riding it for several sessions. This is a "walking the band" downtrend, though price is stretched and prone to a relief bounce. [Bearish]
- CMF (20): -0.068, below the -0.05 threshold. It has been negative throughout the recent decline and has only briefly improved to -0.02. This indicates mild but persistent distribution. [Distribution]
- ADX (14): 31.2 and rising (up from 20.7 on Oct 19), with −DI at 39.2 well above +DI at 14.8. This is a strong, established downtrend with the bears fully in control. [Strong Trend – Bearish]
- Volume: 52.27M, above the typical baseline on the chart. The selloff is accompanied by occasional high-volume down days and no volume capitulation spike yet. Heavier volume on the downside confirms the trend. [Bearish confirmation]
DIVERGENCES & TRENDS
- No bullish RSI divergence yet. RSI is at 30.6, roughly in line with prior lows, and price is making new lows with RSI flat. There is no clear higher low in RSI to signal a reversal.
- Moving average structure is fully bearish. Price ($62.08) < EMA 50 ($70.62) < SMA 50D ($72.67) < EMA 200 ($81.33) < SMA 200D ($81.60) < VWAP ($85.31). Price is below the SMA 200D, which means a long-term downtrend.
- A death cross is already in place. The SMA 50D is below the SMA 200D and the gap is widening ($72.67 vs $81.60). The EMA 50 is also below the EMA 200.
- MACD is bearish and widening. The bearish crossover happened around Oct 21 and the histogram has been expanding negative since.
- Trend strength is building. ADX has risen from about 20 to 31 while −DI leads by more than 24 points. The market has moved from a weak trend to a strong one.
- Lower highs and lower lows. The September bounce to the mid-$80s failed below the 200-day averages, and price has since made new lows near $62.
CHART PATTERNS
- Larger structure: The multi-month chart shows a persistent downtrend from about $119 to $62. The rallies in March–April and August both failed under the 200-day averages. This looks like a stair-step decline with lower highs, consistent with a bearish continuation of the trend.
- Recent action: The late-September to October drop from about $80 to $62 follows a small rising channel/wedge rollover (similar to a Bearish Rising Wedge), which broke down. The measured-move target of the breakdown points toward the low $60s or below.
- Support check: The $60.16–$60.70 area (the chart low plus the lower Bollinger Band) is the immediate floor. A break below would open a new leg down with no clear prior support, since price is at multi-period lows.
- Bullish counterpoint: RSI at about 30 and price at the lower band set up a mean-reversion bounce toward the EMA 50 ($70) and SMA 50D ($72–73). That bounce would likely fail beneath the falling averages.
POTENTIAL SCENARIOS
- Scenario 1: Bearish Trend Continuation — The strong downtrend (ADX 31, −DI dominant, MACD widening) continues with only shallow bounces. The stock breaks the lower Bollinger Band and the $60 area and drifts lower. Trigger: Daily close below $60.16 on rising volume. Target: $54–$57. Invalidation: Close above $70.60 (the EMA 50). (45% probability)
- Scenario 2: Neutral/Bearish Oversold Bounce Then Fade — RSI at 30 and price at the lower band trigger a relief rally toward the EMA 50/SMA 50D. Sellers then defend the falling averages, so price ends the period modestly below or near the current level. Trigger: RSI turns up through 35 and MACD histogram flattens. Target: $68–$72 on the bounce, fading back to $60–$64. Invalidation: Sustained close above $73. (35% probability)
- Scenario 3: Bullish Reversal — Capitulation volume and a bullish RSI divergence mark a bottom, and price reclaims the EMA 50 and SMA 50D. Trigger: Close above $72.70 with CMF turning above +0.05. Target: $76–$80. Invalidation: Close below $60. (20% probability)
PRICE TARGETS
For the 62-day horizon (to about Jan 2, 2027), the guideline range width is about 18–30% of the current price. I use about 28%.
- Target Price: $58.50
- Expected Range: $50.00 to $67.50 (width $17.50 = about 28% of the current price, consistent with the 61–180 day guidance)
- Key Levels: Support at $60.16, Resistance at $70.62
OVERALL BIAS
OVERALL BIAS: BEARISH - Price is below every major moving average with a death cross in place, MACD is widening negative, and ADX at 31 with −DI far above +DI confirms a strong downtrend. An oversold bounce is possible, but the evidence favors the trend continuing over the 62-day window.
This is educational analysis and not financial advice.