NOK 62-day bearish forecast — Nov 1, 2026
- Bias: Bearish
- Timeframe: 62 days (made Nov 1, 2026, target date Jan 1, 2027)
- Price at analysis: $8.56
- Price target: $8.00
- Expected range: $6.90 – $8.95
- Result: Pending — graded after the close on Jan 1, 2027
Get a free AI analysis of NOK today
Analysis
TECHNICAL INDICATORS
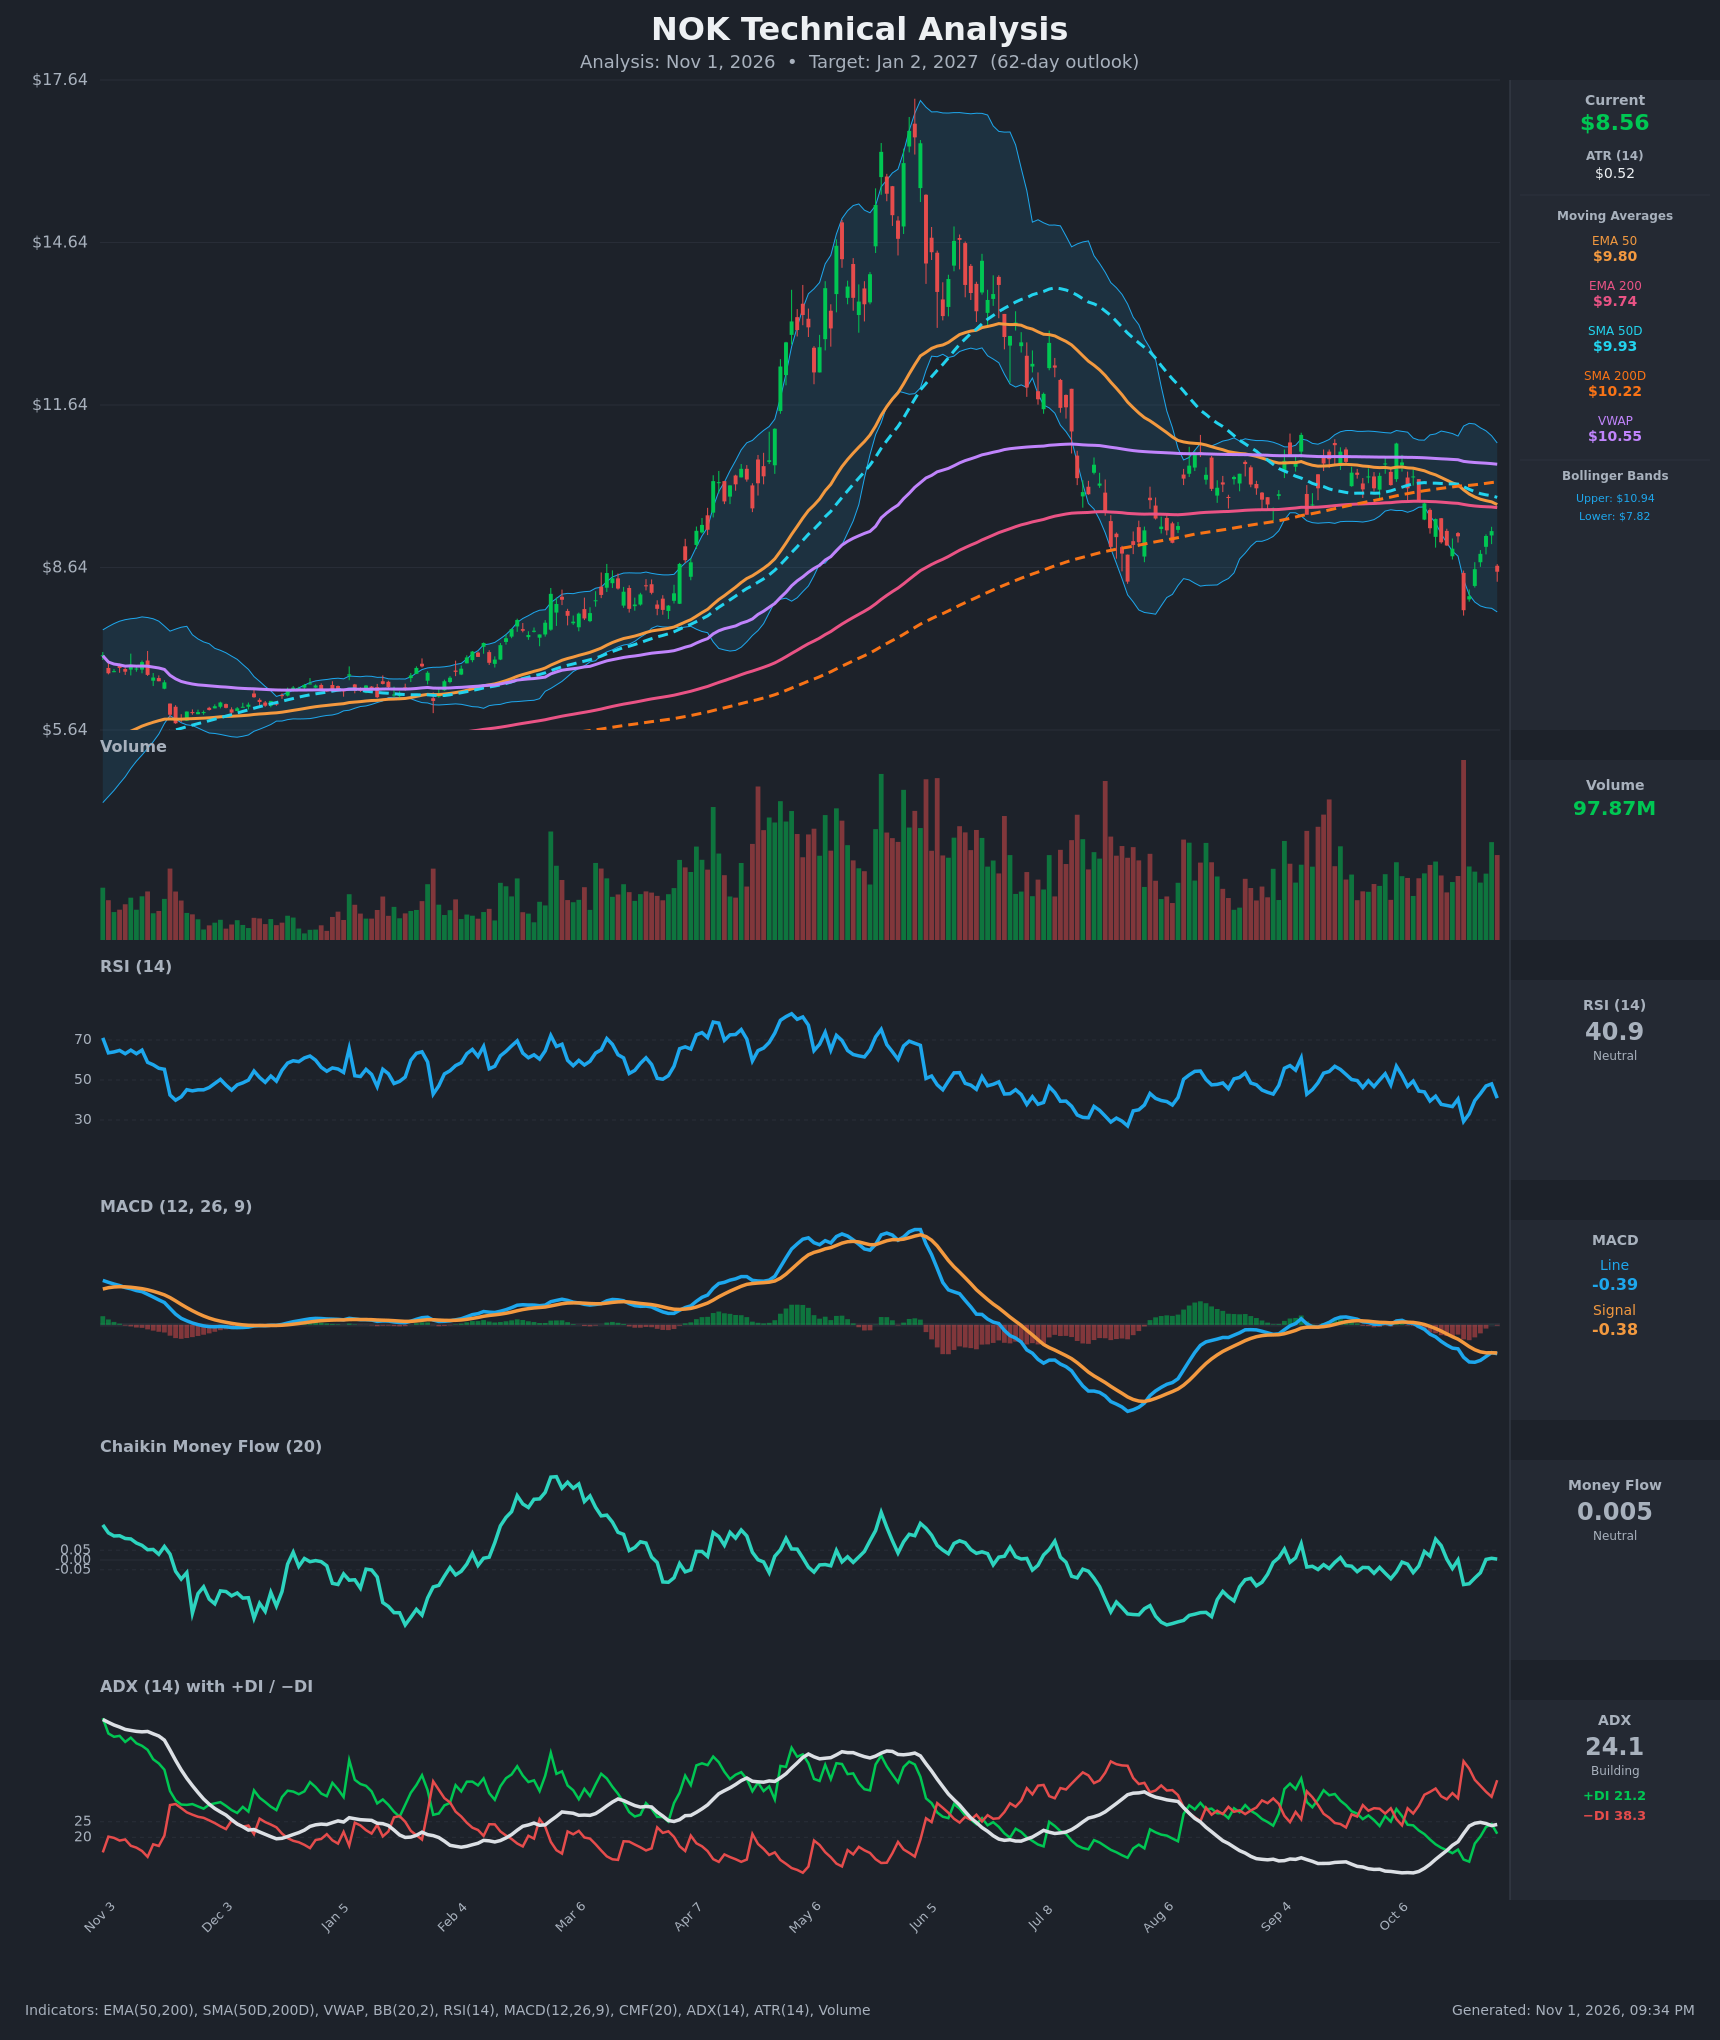
- RSI (14): 40.93, dropped from 48.0 on Oct 29 after a -8% day. It sits below the 50 midline but above oversold. It bottomed at 29.3 on Oct 22, so momentum is weak but not washed out. [Bearish]
- 20 EMA: Not supplied. The 50 EMA at $9.80 and 200 EMA at $9.74 both sit well above the $8.56 price, so the moving-average stack acts as overhead resistance. Price is about 12.7% below the EMA 50. [Bearish]
- MACD: Line -0.386 is below signal -0.376, a fresh bearish re-cross after a brief bullish cross on Oct 29. Both lines are negative and near the lows of the recent range, and the histogram is slightly negative. [Bearish]
- Bollinger Bands (20): Upper $10.94, lower $7.82, midline about $9.38. Price at $8.56 is in the lower half of the bands, about 0.24 on %B. It bounced from the lower band (the Oct 22 low at $7.85) and was rejected near the midline. The bands are fairly wide after the Oct 22 gap-down. [Bearish]
- CMF (20): 0.005, between ±0.05 and flat. Recent readings oscillate around zero, so there is no clear accumulation or distribution. [Neutral]
- ADX (14): 24.1, building and close to the 25 threshold. −DI at 38.3 is far above +DI at 21.2, so bears control. The trend is borderline-strong and tilted down. [Strong Trend (borderline) – Bearish]
- Volume: 97.87M on the latest bar, which fell sharply. The Oct 22 selloff came on a very large volume spike, and the last bounce had fading volume. Heavy volume on down days is bearish. [Bearish]
DIVERGENCES & TRENDS
- Price made a lower low on Oct 22 ($7.85). The Oct 30 close of $8.56 is above that low, and RSI at 40.9 is well above 29.3, so this is a higher low, not a divergence. It does show a partial recovery that has since stalled.
- There is a death cross in the SMA50D/SMA200D. The SMA50D at $9.93 is below the SMA200D at $10.22, and the gap has been widening since mid-October.
- EMA50 ($9.80) is above EMA200 ($9.74), but the gap is narrowing quickly. A bearish EMA cross is likely soon, since EMA50 has fallen from $10.45 to $9.80 in 15 bars.
- Price is below every moving average and VWAP ($10.55), which confirms a downtrend.
- The MACD re-cross to bearish and the ADX rise with −DI dominant (a −DI jump from 33 to 44 on Oct 22) show the bearish trend strengthening.
- The chart shows a peak near $17 in late May to early June, then a major decline. The entire rally back to $10 was given up. The decline is now breaking below the $9.0–$10.5 consolidation range of Aug–Oct.
CHART PATTERNS
- The long-term chart looks like a Bearish Head and Shoulders / large rounded top. The peak is near $17, with lower shoulders around $10.5–$11 in Sep–Oct, and the neckline is around $9.0–$9.20 (the Aug–Oct range floor). Price has broken below this level.
- The Aug–Oct consolidation resembled a Descending Triangle / rectangle with support around $9.0–$9.2. The break below it targets roughly $7.0–$7.50, measured from the range height of about $1.5–$2.
- The bounce from $7.85 to $9.31 and the rejection to $8.56 may be a Bearish Flag or retest of broken support. If it is, it points to a continuation lower.
- Key support is the Oct 22 low at about $7.85, then $7.00–$7.50.
POTENTIAL SCENARIOS
- Scenario 1: Bearish Breakdown Continuation — The pattern breakdown below the $9.0–$9.2 neckline continues, with price failing at the retest and making new lows. Trigger: a daily close below $7.85. Target: $7.00–$7.50. Invalidation: a daily close above $9.80 (EMA50/EMA200 zone). (50% probability)
- Scenario 2: Neutral Range Basing — Price consolidates between the Oct 22 low and the broken support, with ADX rolling over. Trigger: holding $7.85 and failing to clear $9.30. Target: $7.90–$9.20. Invalidation: a close beyond either edge of the range. (28% probability)
- Scenario 3: Bullish Recovery Reclaim — A bounce off the lower Bollinger Band and a rising CMF lead to a reclaim of the broken support and the moving-average cluster. Trigger: a close above $9.35 on rising volume. Target: $9.80–$10.20. Invalidation: a close below $8.00. (22% probability)
PRICE TARGETS
For the 62-day horizon (30-60 day guidance of 12-18%, extended to the 61-180 day band at 18-30%; I use ~22%):
- Target Price: $8.00
- Expected Range: $6.90 to $8.95 (width $2.05, about 24% of the current price, in line with the 61-180 day guidance)
- Key Levels: Support at $7.85, Resistance at $9.20
OVERALL BIAS
OVERALL BIAS: BEARISH - Price is below all key moving averages and VWAP, a SMA death cross is in place, −DI dominates with ADX near 25, and MACD has re-crossed bearish. The breakdown from the $9.0–$9.2 range supports a drift toward the $7–$8 area.
This is educational analysis and not financial advice.