NVDA 62-day bearish forecast — Nov 1, 2026
- Bias: Bearish
- Timeframe: 62 days (made Nov 1, 2026, target date Jan 1, 2027)
- Price at analysis: $204.64
- Price target: $197.00
- Expected range: $183.00 – $228.00
- Result: Pending — graded after the close on Jan 1, 2027
Get a free AI analysis of NVDA today
Analysis
TECHNICAL INDICATORS
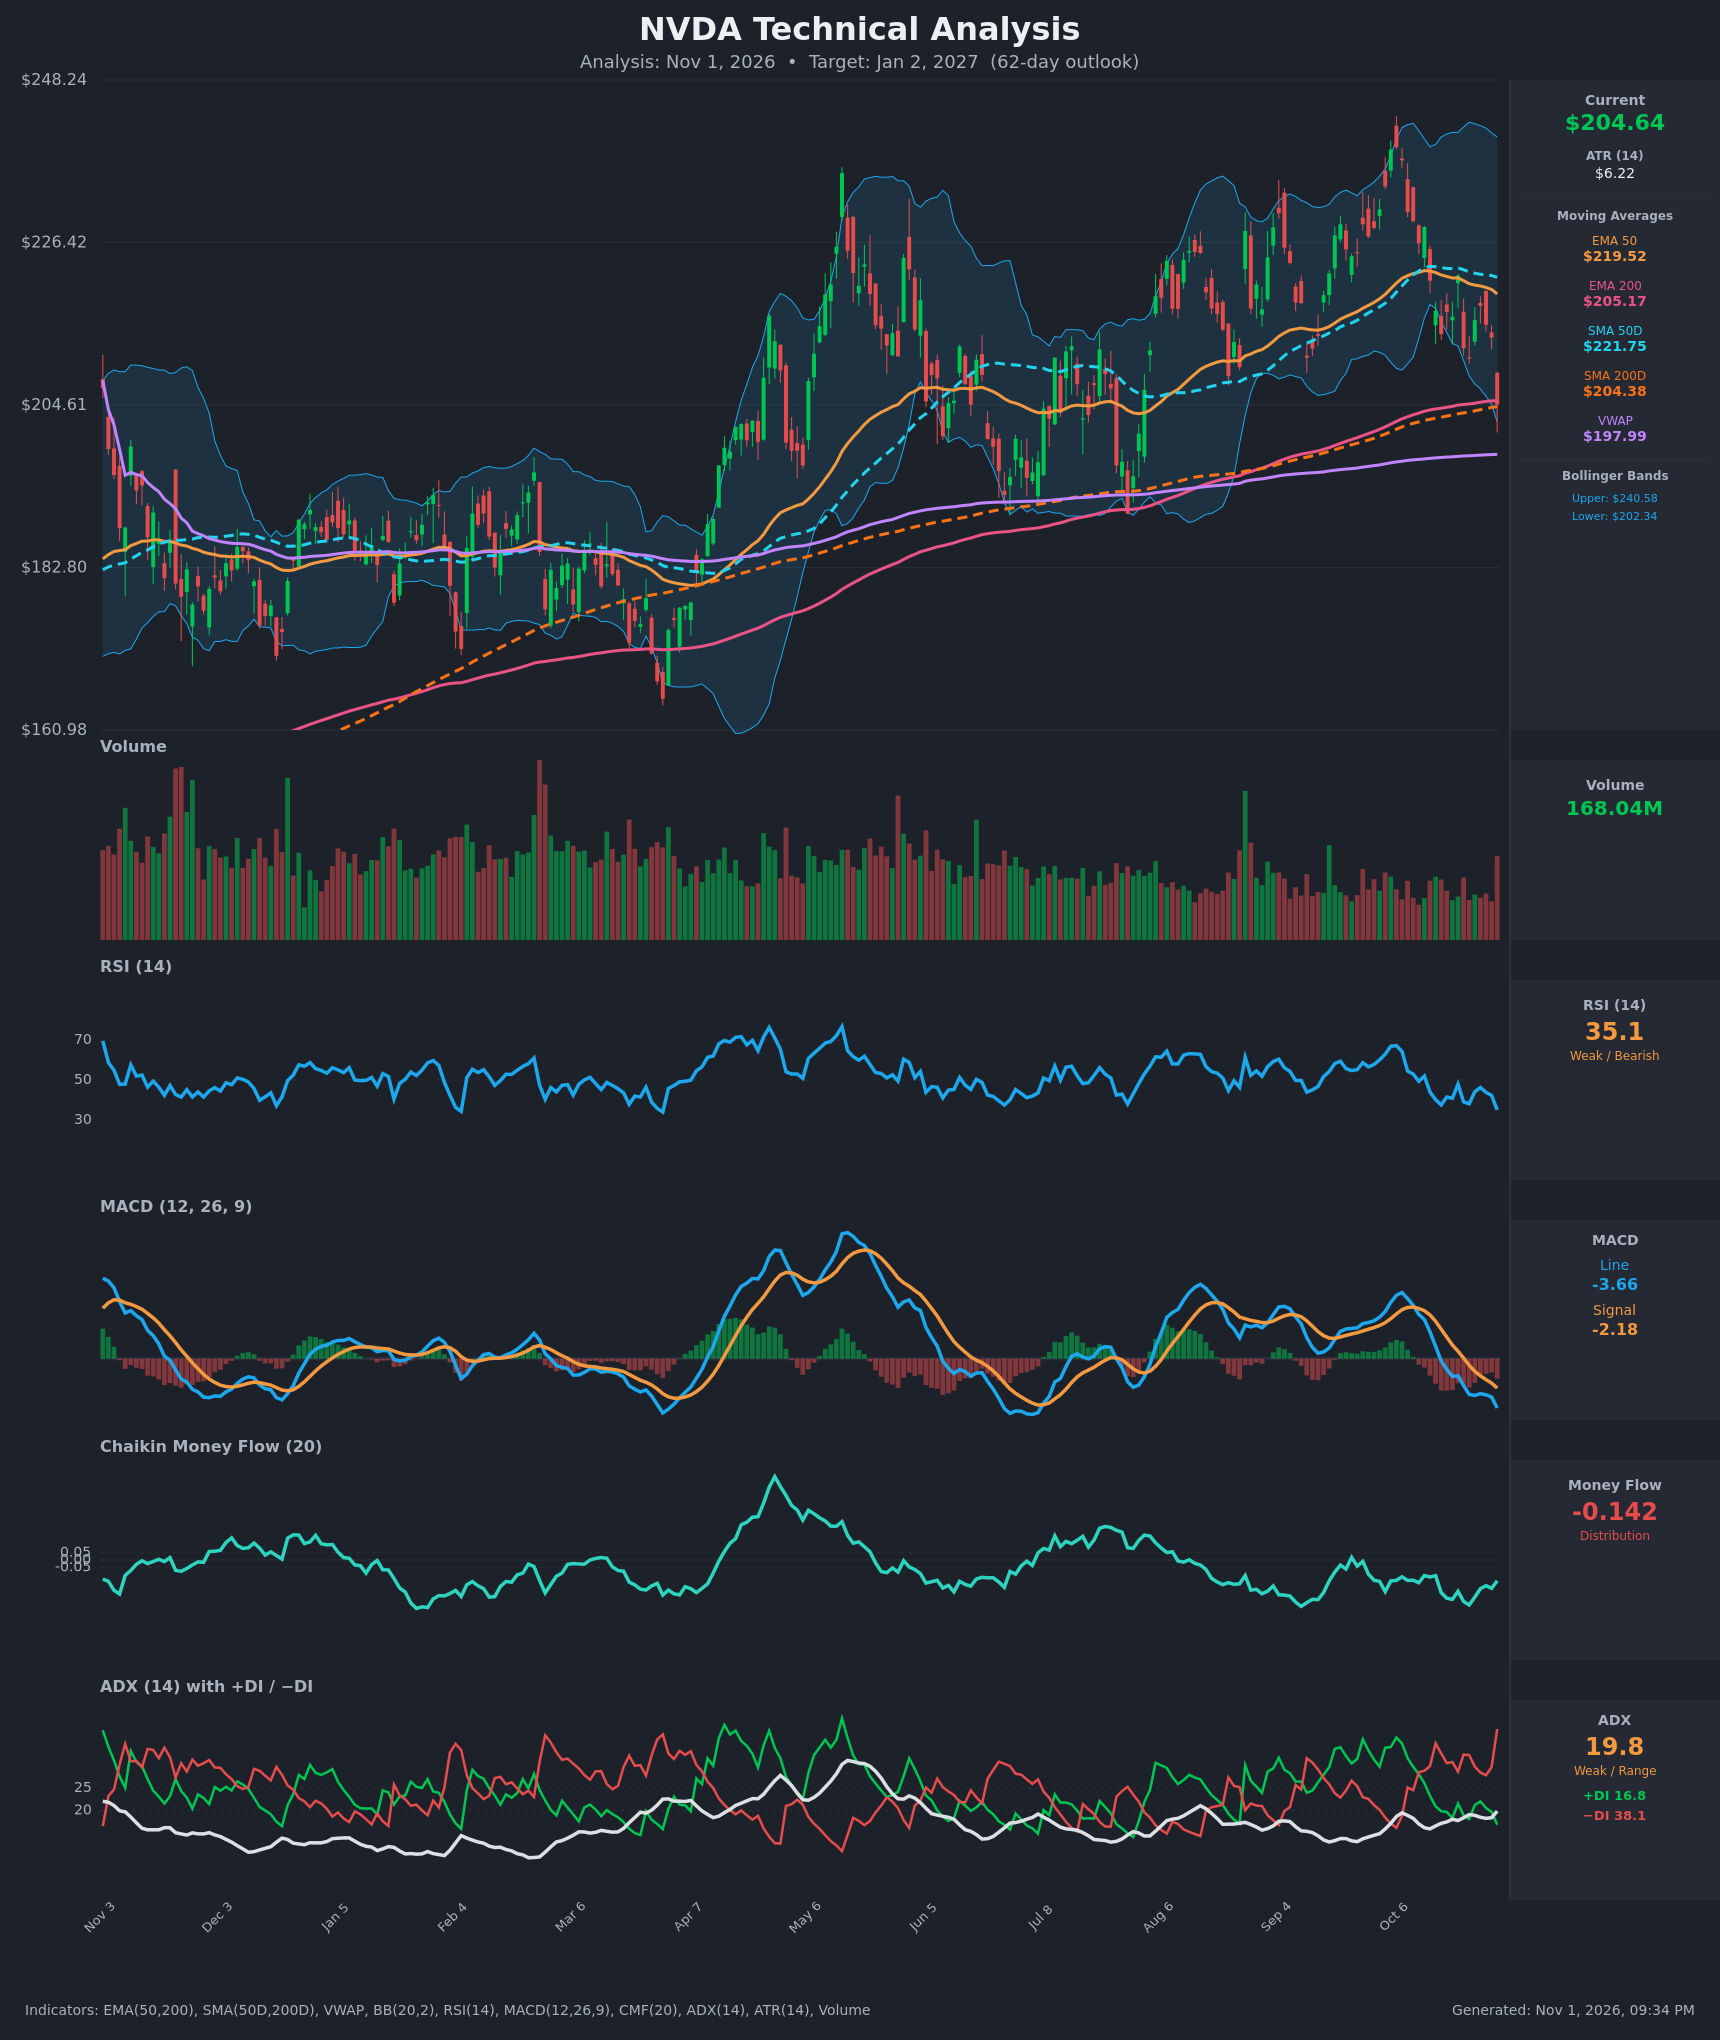
- RSI (14): 35.06, down from 49 on Oct 12 and near the 30 oversold line. Momentum is clearly falling, with lower RSI lows on each leg down. It is not yet oversold, so there is room for further weakness. [Bearish]
- 20 EMA: Not provided. Using the EMA50 ($219.52) as a proxy, price is about 7% below it and the EMA50 is sloping down. It now acts as overhead resistance, and the SMA50D ($221.75) is rolling over as well. [Bearish]
- MACD: Line -3.66 is below signal -2.18, and both are negative. The bearish crossover occurred around Oct 16-22, and the line is still diverging from the signal, so the histogram is widening negative. [Bearish]
- Bollinger Bands (20): Price at $204.64 is hugging the lower band ($202.34), with the upper band at $240.58. The bands are wide after the October rally and reversal. A band-walk down is possible, but a lower-band tag also often marks a short-term bounce. [Neutral]
- CMF (20): -0.142 is well below -0.05 and has been negative for weeks, with no accumulation seen since the October peak. Sellers dominate volume flow. [Distribution]
- ADX (14): 19.8 and edging up from about 16, with −DI (38.1) far above +DI (16.8). The trend is not yet established, but the directional pressure is decisively bearish and the −DI spike suggests a fresh down-leg is starting. [Weak but strengthening Trend, Bearish direction]
- Volume: 168.04M on the latest bar, a pickup versus the lighter volume of recent weeks, and it accompanied the drop to $204.64. Heavier volume on a down day supports the selling. [Bearish]
Other moving average context:
- EMA50 ($219.52) and SMA50D ($221.75) are above price.
- EMA200 ($205.17) and SMA200D ($204.38) are right at price, so the stock is testing its long-term trend line.
- VWAP ($197.99) sits below price and is the next support.
- EMA50 and SMA50D sit above their 200 counterparts, so there is no death cross, but the 50s are rolling over.
DIVERGENCES & TRENDS
- There is no bullish RSI or MACD divergence yet. RSI and MACD are making lower lows in step with price.
- On the chart, the Oct high near $240 coincided with an RSI peak of about 67, below the RSI peaks of 70+ in April-May. That is a mild bearish divergence at the top, since price made a higher high with weaker momentum.
- MACD crossed down and is accelerating below zero. CMF has stayed negative throughout, showing distribution.
- Price has fallen from about $240 to $204.64 (-15%) in a few weeks and is now sitting on the 200-day EMA/SMA cluster, the key long-term pivot.
- −DI has crossed decisively above +DI, and the DI gap is the widest in months.
- Price is below the EMA50 and SMA50D, but still marginally above the 200-day averages.
CHART PATTERNS
- Bearish Double Top (potential): Peaks near $233 (May) and about $241 (Oct), with the neckline around $190 (the Jun/Aug lows). A confirmed close below $190 would project a very large measured move toward $140. Within 62 days, only a partial move toward $185-190 is realistic.
- Range/channel structure: Price has been in a rising channel since April, and the 200-day averages have acted as the channel floor. The stock is testing that floor now.
- Failed breakout: The Oct push to $240 reversed sharply, which is the bearish rejection that fits the Double Top.
- The Bearish Rising Wedge is not clearly formed. A rebound would instead resemble a bull flag within the larger uptrend.
- The pattern is incomplete until the neckline breaks. A hold at the 200-day cluster would invalidate it.
POTENTIAL SCENARIOS
- Scenario 1: Bearish Breakdown Below the 200-Day Cluster — The 200 EMA/SMA ($204-205) fails, −DI stays dominant, and price slides toward the VWAP and the prior Aug lows, with a potential retest of the Double Top neckline. Trigger: daily close below $202 (lower Bollinger Band) with MACD still falling. Target: $190-195, extending to $183. Invalidation: daily close back above $221 (SMA50D). (50% probability)
- Scenario 2: Bullish Bounce Off the 200-Day Support — The long-term trend line holds, RSI turns up from the mid-30s, and price retraces toward the moving averages. Trigger: strong close above $212 with a MACD histogram turn. Target: $219.50-$222 (EMA50/SMA50D), and possibly $228. Invalidation: close below $198. (33% probability)
- Scenario 3: Neutral Chop Around the 200-Day Averages — Price consolidates between about $195 and $215 as ADX stays under 20. Trigger: low-volume, overlapping candles. Target: $200-208. Invalidation: close beyond $190 or $222. (17% probability)
PRICE TARGETS
- Target Price: $197.00 (62-day horizon, about Jan 2, 2027)
- Expected Range: $183.00 to $228.00 (width $45 = 22.0% of the current price, within the 18-30% guidance for 61-180 days)
- Key Levels: Support at $190.00 (Aug low/neckline, with $202.34 lower band and the $204 200-day cluster as the first pivot), Resistance at $219.50 (EMA50, with SMA50D at $221.75 just above)
OVERALL BIAS
OVERALL BIAS: BEARISH - Every momentum and flow gauge points down: RSI 35 and falling, MACD below signal and below zero, −DI (38.1) far above +DI (16.8), CMF -0.142 showing distribution, and price below the 50-day averages. The stock is on its last long-term support (the 200-day cluster, about $204-205), and a loss of it opens a move toward $190 and lower, while the oversold-bounce scenario is the main risk.
This is educational analysis and not financial advice.