RKLB 62-day bearish forecast — Nov 1, 2026
- Bias: Bearish
- Timeframe: 62 days (made Nov 1, 2026, target date Jan 1, 2027)
- Price at analysis: $54.73
- Price target: $52.00
- Expected range: $42.50 – $60.50
- Result: Pending — graded after the close on Jan 1, 2027
Get a free AI analysis of RKLB today
Analysis
TECHNICAL INDICATORS
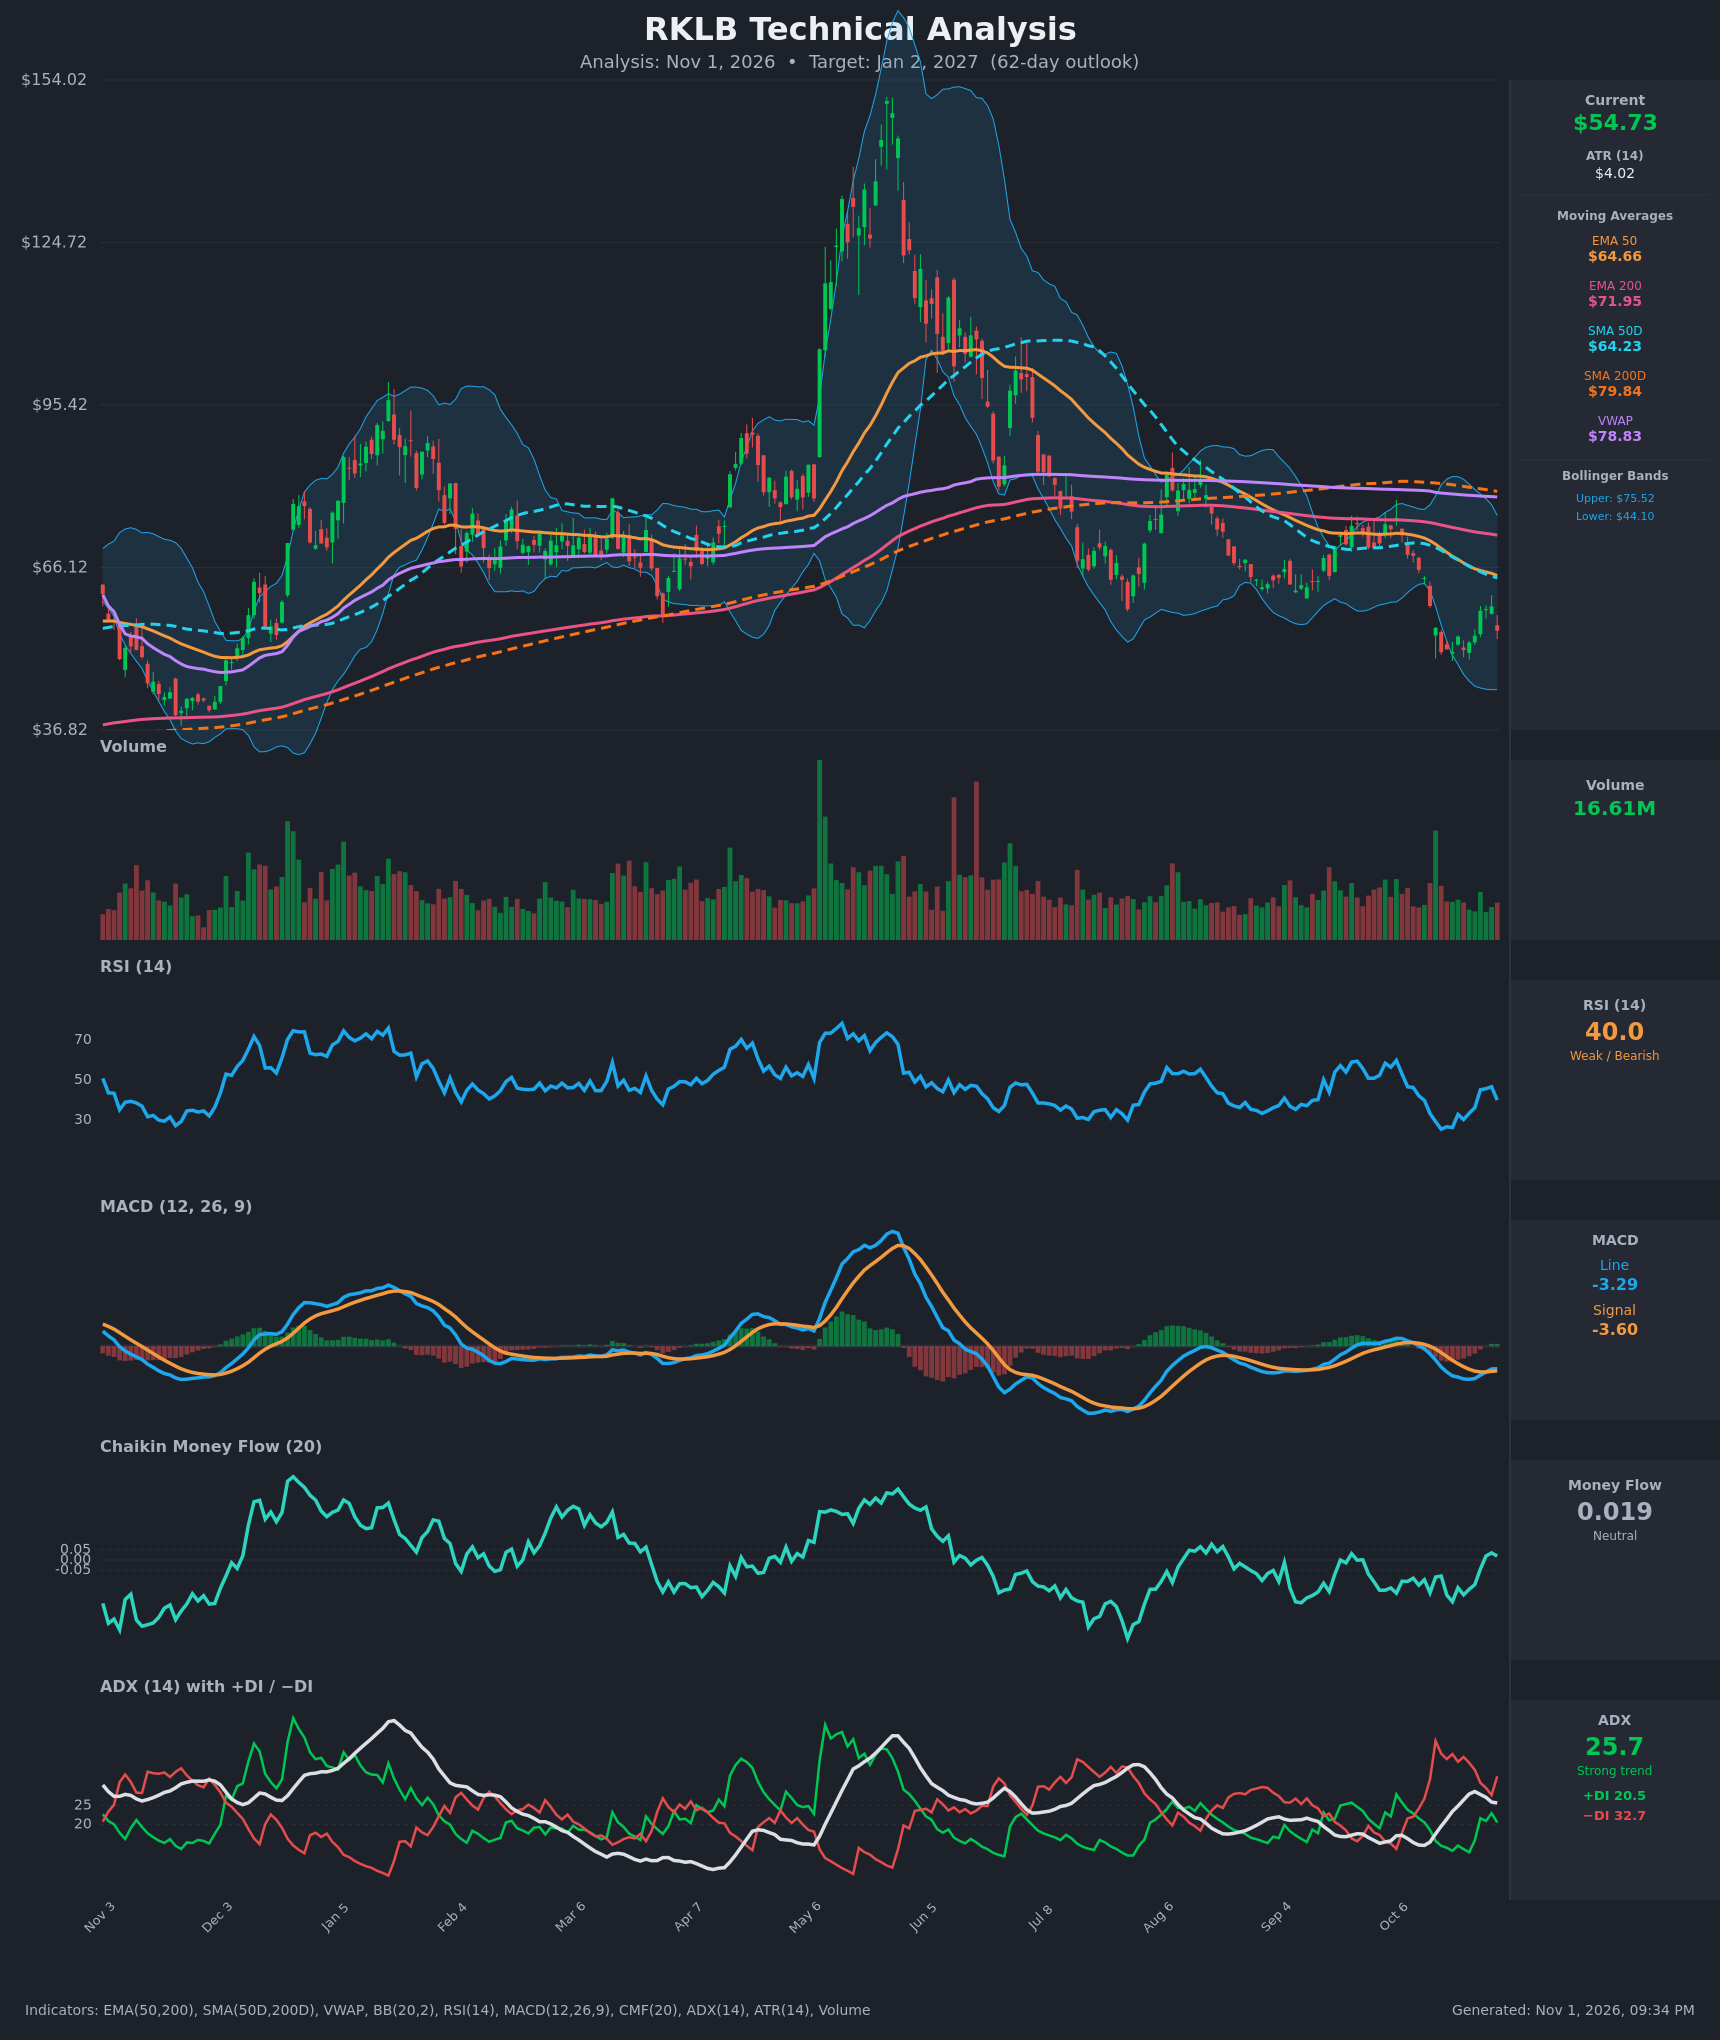
- RSI (14): 39.96, which is below 50 and in weak territory. It bounced from oversold (25.4 on Oct 16) to 46.6 on Oct 29 and has now rolled over to 40. It has made lower highs since the early-year peak, so momentum is still bearish, though it is not oversold. [Bearish]
- 20 EMA: Not supplied. Using the EMA 50 at $64.66 as a proxy, price at $54.73 is about 15% below it, so the average acts as overhead resistance. The EMA 50 is also falling steeply (from $71.72 to $64.66 in 15 bars). [Bearish]
- MACD: Line -3.29 is just above Signal -3.60, a marginal bullish crossover on Oct 28 to 29. The histogram is slightly positive (+0.31). Both lines sit deep below zero, so this is only a weak relief bounce within a downtrend. The Oct 30 drop to $54.73 could stall the crossover. [Neutral]
- Bollinger Bands (20): Upper $75.52, lower $44.10, midline about $59.81. Price is in the lower half, below the midline, after touching the lower band area (~$50.84) in mid-October. The bands are wide, so volatility is high. [Bearish]
- CMF (20): 0.019, between ±0.05, so neutral. It improved from -0.205 (Oct 20) to slightly positive, which signals the selling pressure has faded without real accumulation. [Neutral]
- ADX (14): 25.7 with +DI 20.5 and −DI 32.7. ADX is above 25 and rose from 14.5 over the past two weeks, so a strong trend is established. −DI is well above +DI, so bears control. [Strong Trend – Bearish]
- Volume: 16.61M, about average. There was no capitulation spike on the October decline, and volume has been modest on the bounces. That leaves a tentative base and no clear reversal signal. [Neutral]
Moving-average structure:
- Price ($54.73) is below the EMA 50 ($64.66), EMA 200 ($71.95), SMA 50D ($64.23), SMA 200D ($79.84) and VWAP ($78.83), so the whole stack is bearish.
- EMA 50 is below EMA 200 and SMA 50D is below SMA 200D. That is a death cross that has already happened, and the gap is still widening.
DIVERGENCES & TRENDS
- Price vs RSI: The Oct 16 low (~$50.84, RSI 25.4) and the Oct 20 retest ($50.90, RSI 26.2) show a mild RSI higher-low and a double-bottom attempt. It has not been confirmed by a break above the bounce high near $59–60.
- MACD: The line is flattening and curling above its signal, which suggests the downside momentum is easing. It remains deeply negative.
- Trend: Lower highs and lower lows since the June peak near $150. Price has fallen about 64% from that high and broke below the $60–66 support zone in mid-October.
- ADX/DI: −DI has been above +DI since Oct 12 and ADX is rising. The trend is bearish and still intact.
- Rejection: The rally to $59.10 faded back to $54.73, and the stalled MACD crossover leaves the relief bounce looking vulnerable.
CHART PATTERNS
- Bearish trend continuation / possible Bearish Pennant or Flag: A sharp drop from $65.71 to $50.84, then a small bounce to $59.10 that is now rolling over. A break of the Oct low near $50.8 would confirm continuation, with a measured move toward the mid-$40s (the lower Bollinger Band at $44.10).
- Possible Bullish Double Bottom: The $50.84 and $50.90 lows with a neckline near $59–60. A close above $60 would activate it with a target near $68–69. Right now it is unconfirmed and the weaker case.
- Longer-term structure: The price is in a large post-peak decline (the parabolic peak, then a descending channel of lower highs), which is a bearish structure. The $66–72 area is heavy resistance.
POTENTIAL SCENARIOS
- Scenario 1: Bearish Trend Continuation — Price fails at the $59–60 neckline and the falling EMA 50 area, breaks the October lows, and the downtrend extends with −DI dominant. Trigger: close below $50.80. Target: $44–46 (lower Bollinger Band and a measured move). Invalidation: close above $60 on rising volume. (50% probability)
- Scenario 2: Neutral Base Building / Range — Price forms a base between $50 and $60 as RSI and CMF stabilise and the MACD crossover holds. Trigger: holds above $50.8 and fails to clear $60. Target: $50–60 range-bound, ending near $54–56. Invalidation: close outside $48–62. (22% probability)
- Scenario 3: Bullish Double-Bottom Reversal — The relief bounce extends as the MACD crossover holds and CMF turns positive. Trigger: close above $60 with volume. Target: $64–69 (EMA 50, SMA 50D and the pattern target). Invalidation: close below $50.8. (28% probability)
PRICE TARGETS
Timeframe: 62 days (range width should be about 18–30% of price, ~$10–16).
- Target Price: $52.00 (modestly below the current price: the bearish trend and DI/ADX structure outweigh the stabilising momentum)
- Expected Range: $42.50 to $60.50 (width $18.00, about 33% of the current price; slightly wider than the guide to reflect the ATR of $4.02 and high volatility)
- Key Levels: Support at $50.80, Resistance at $59.10
OVERALL BIAS
OVERALL BIAS: BEARISH - Price is below every moving average with a completed death cross. ADX is above 25 with −DI well above +DI, and the relief bounce has already stalled. The MACD and CMF stabilisation is only a minor offset, and the downside risk is toward the mid-$40s unless $60 is reclaimed.
This is educational analysis and not financial advice.