PLTR 62-day bearish forecast — Nov 1, 2026
- Bias: Bearish
- Timeframe: 62 days (made Nov 1, 2026, target date Jan 1, 2027)
- Price at analysis: $184.11
- Price target: $174.00
- Expected range: $156.00 – $197.00
- Result: Pending — graded after the close on Jan 1, 2027
Get a free AI analysis of PLTR today
Analysis
TECHNICAL INDICATORS
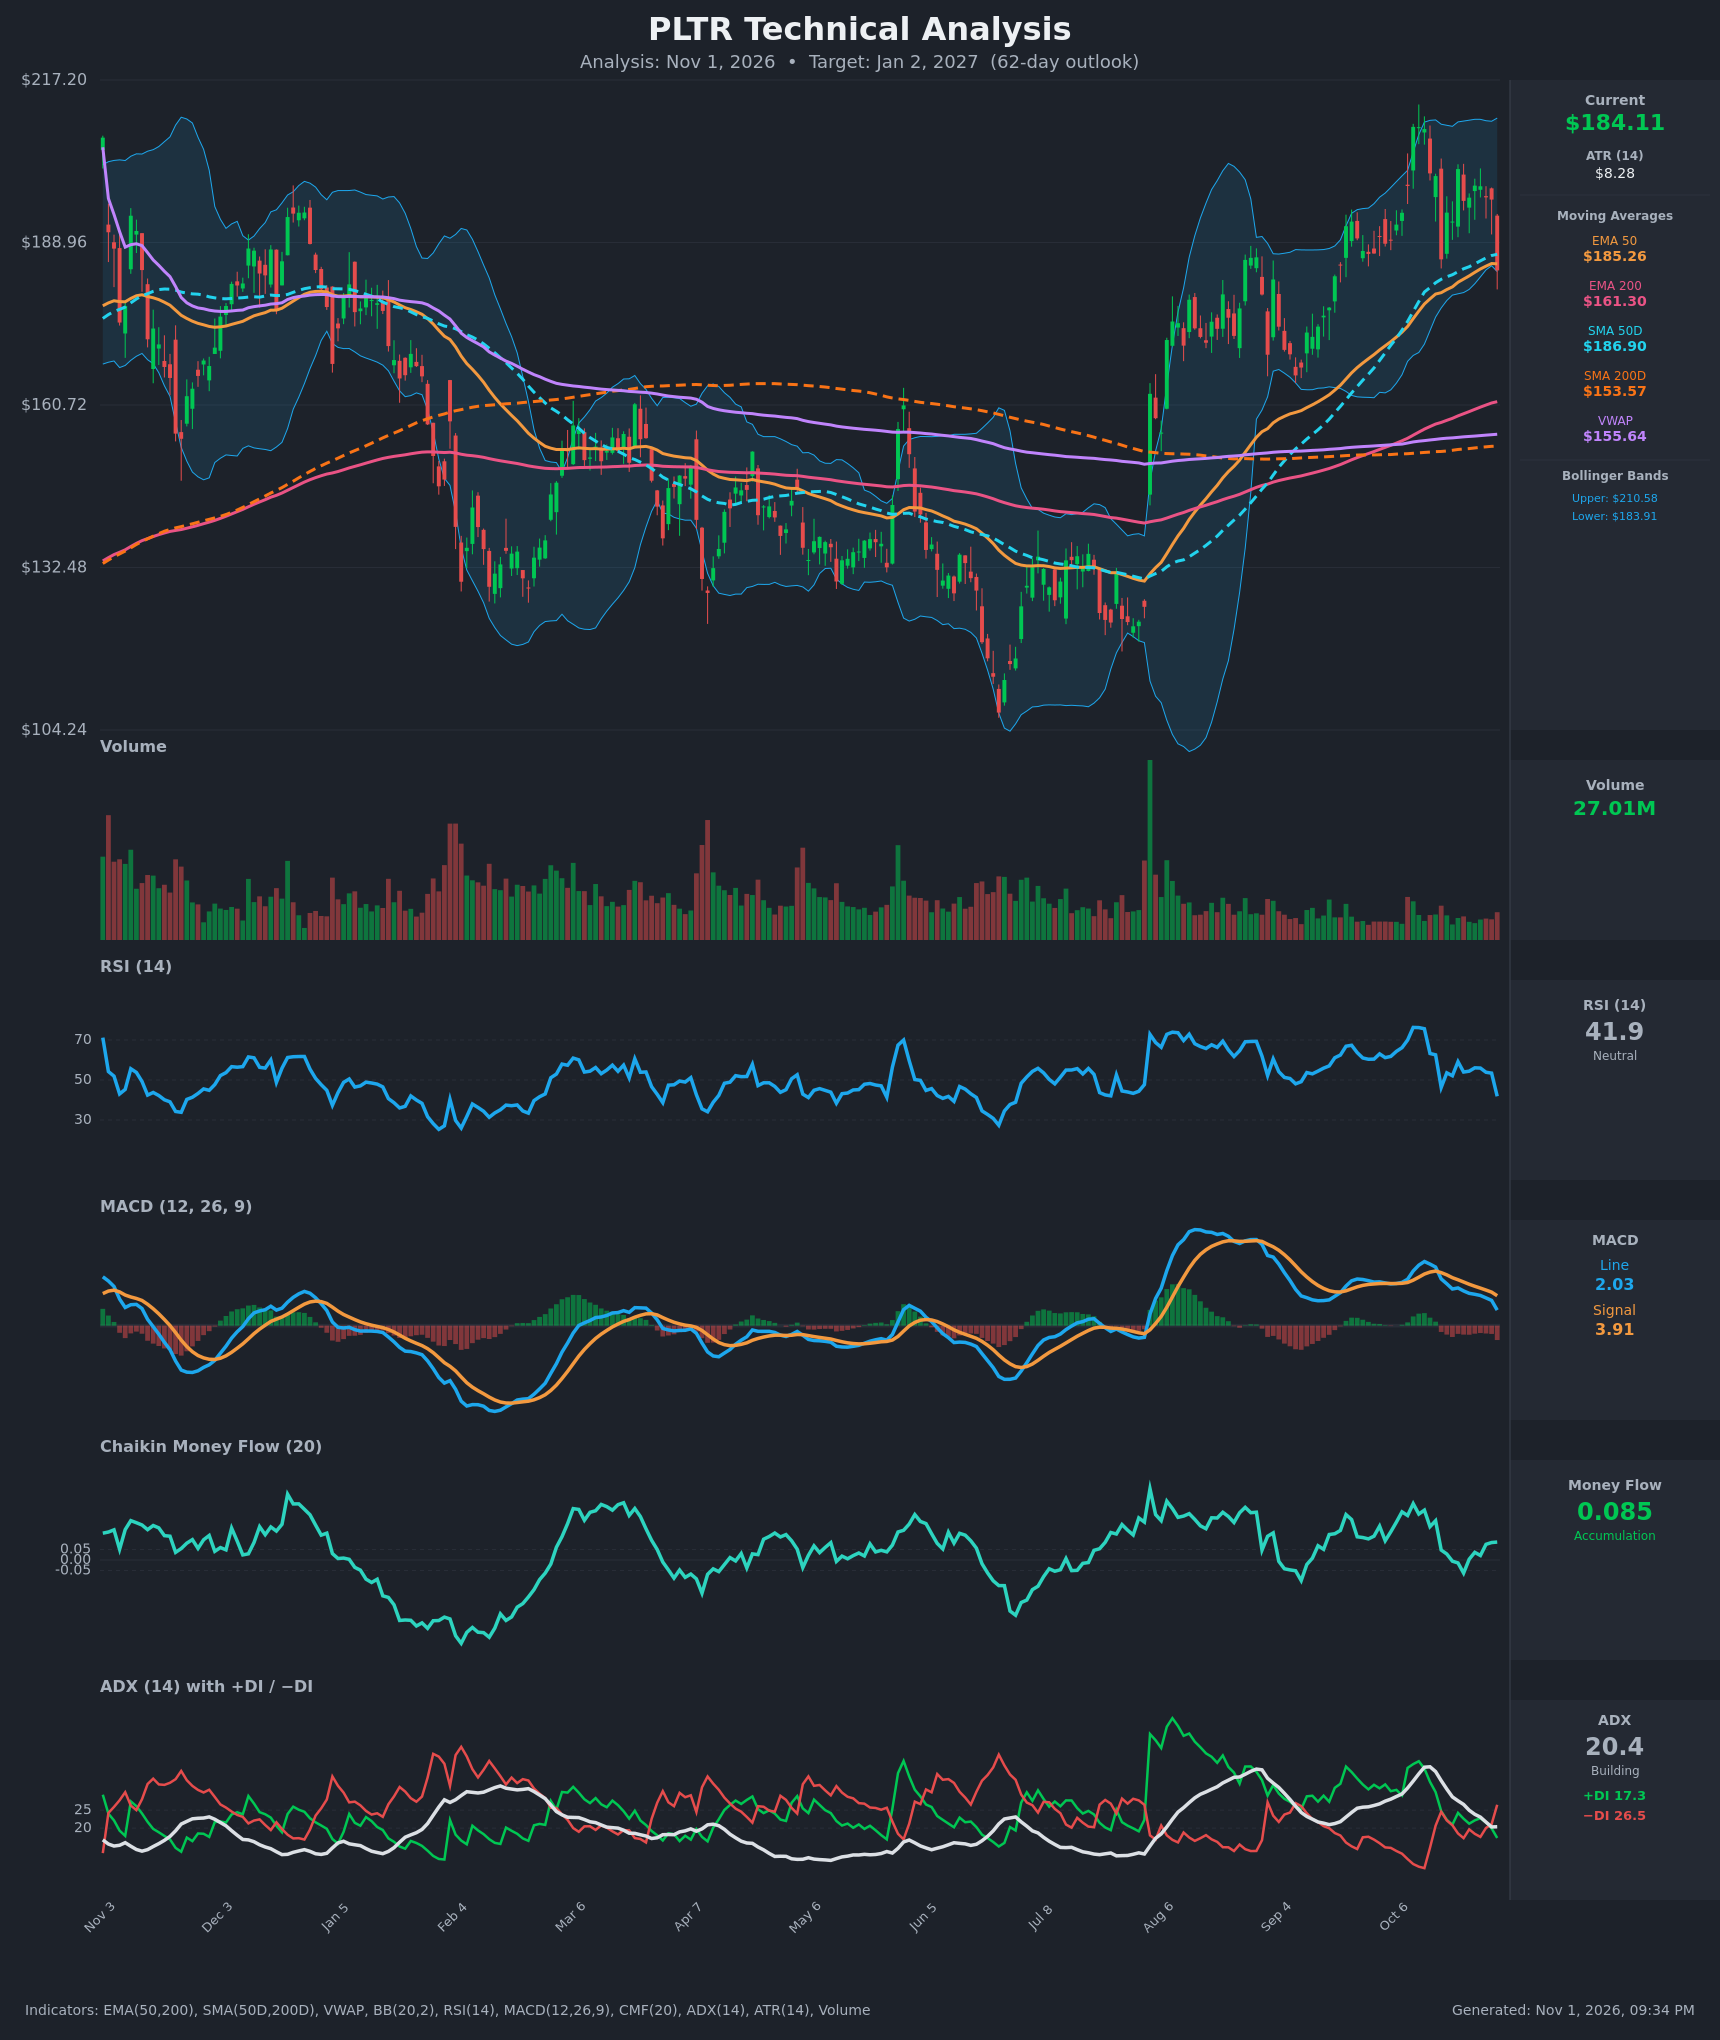
- RSI (14): 41.86, down sharply from 53.4 the day before and from 76 in mid-October. It is below the 50 midline, with momentum rolling over but not yet oversold. [Bearish]
- 20 EMA: No 20 EMA value was supplied, so I use the EMA 50 ($185.26) and SMA 50 ($186.90) as the short/intermediate trend proxies. Price at $184.11 closed below both for the first time since the August breakout, so they now act as overhead resistance. EMA 200 ($161.30) is far below and still rising. [Bearish]
- MACD: Line 2.03 is below Signal 3.91, a bearish crossover that occurred around Oct 16. The histogram is negative (about -1.9) and widening. Both lines are falling from the early-October peak of 8.4, though they remain above zero. [Bearish]
- Bollinger Bands (20): Upper $210.58, lower $183.91. Price closed at the lower band after a roughly 6% one-day drop from $196.42. A band-walk lower would signal continuation, while a quick reclaim would signal a mean-reversion bounce. The bands are wide, which is consistent with elevated volatility. [Neutral]
- CMF (20): 0.085, above the +0.05 threshold and stable for several days. Buying pressure has not yet turned to distribution despite the sell-off, though it has faded from 0.24 in mid-October. [Accumulation]
- ADX (14): 20.4, borderline between range-bound and trending. +DI is 17.3 and −DI is 26.5. The DIs crossed bearishly on the last bar, with −DI jumping from 21.1 to 26.5. A weak trend is turning down. [Weak Trend, Bearish direction]
- Volume: 27.01M, modest against the August breakout spike and the early-year averages. The drop came on moderate volume, so it is not a capitulation. It also shows no strong dip-buying interest yet. [Mildly Bearish / Neutral]
DIVERGENCES & TRENDS
- Momentum: RSI fell from 76 to 42 and MACD fell from 7.9 to 2.0 while price held in a $184-$209 band. That is momentum deterioration from the October peak, and price is now catching down to it.
- Lower highs: Recent closing highs of $209, $201.72 and about $198.8 are progressively lower, a mild bearish lower-high sequence.
- CMF vs price: CMF remains positive (0.085) while price has broken short-term support. This is a mild bullish divergence and the main argument for a bounce.
- Moving averages: The golden cross (SMA 50 over SMA 200) and EMA 50 over EMA 200 remain intact, and price is far above the 200s, so the long-term uptrend is intact. The 50-period averages are flattening and price has lost them.
- Crossovers and breaks: MACD has a bearish signal-line cross, −DI has crossed above +DI, and price has closed below EMA 50 and SMA 50 and at the lower Bollinger Band. VWAP at $155.64 is well below price, so longer-term buyers are still in profit.
CHART PATTERNS
- Bearish Double Top (loose): Peaks near $209 (Oct 12-13) and lower highs after, with a neckline around $184-$186 (the Oct 16 low was $186.03). Today's close at $184.11 is a marginal neckline break. The measured move is roughly $209 − $185 ≈ $24, which projects to about $161. That coincides with EMA 200, which makes $161 a strong confluence target.
- Bearish Rising Wedge / Expanding structure (possible): The post-August advance has a rising-channel character, and the break below the lower channel and the 50-period averages supports a retracement of part of the August-October rally. The pattern is not fully confirmed.
- Caveat: The neckline break is marginal and ADX is only 20. A close back above $187-$190 would invalidate the double-top reading and revert to a consolidation or bull-flag structure.
POTENTIAL SCENARIOS
- Scenario 1: Bearish Neckline Break and Pullback to EMA 200 — Price fails to reclaim the 50-period averages and the neckline break extends. MACD and DI stay bearish, and price drifts toward the rising EMA 200 and the measured-move zone. Trigger: daily close below about $180, or failure at $187-$190. Target: $160-$170. Invalidation: daily close above $196 (the Oct 22-29 swing area). (50% probability)
- Scenario 2: Bullish Reclaim and Trend Resumption — The one-day drop proves a shakeout, with positive CMF and the intact golden cross attracting dip buyers at the lower band. Price reclaims the SMA 50/EMA 50 and retests the highs. Trigger: close above $190 with MACD turning back up. Target: $200-$210. Invalidation: close below $175. (30% probability)
- Scenario 3: Neutral Range Consolidation — ADX stays near 20 and price chops between the 50-period averages and the lower support zone. Trigger: failure to break either $175 or $195 decisively. Target: $175-$192. Invalidation: close outside $170-$200. (20% probability)
PRICE TARGETS
Timeframe: 62 days (Jan 2, 2027).
- Target Price: $174.00
- Expected Range: $156.00 to $197.00. The width is $41, about 22.3% of the current price, which fits the 18-30% guidance for 61-180 days. It is well over 2-3x a short-term range.
- Key Levels: Support at $161.30 (EMA 200 and measured-move target), Resistance at $186.90 (SMA 50, with EMA 50 at $185.26)
OVERALL BIAS
OVERALL BIAS: BEARISH - Price has broken below the EMA 50 and SMA 50 and closed at the lower Bollinger Band, with a bearish MACD crossover, −DI over +DI and RSI below 50. This points to a retracement toward the rising EMA 200 near $161-$170, partly offset by positive CMF and the intact long-term uptrend.
This is educational analysis and not financial advice.