QBTS 62-day bearish forecast — Nov 1, 2026
- Bias: Bearish
- Timeframe: 62 days (made Nov 1, 2026, target date Jan 1, 2027)
- Price at analysis: $10.65
- Price target: $9.60
- Expected range: $7.60 – $12.90
- Result: Pending — graded after the close on Jan 1, 2027
Get a free AI analysis of QBTS today
Analysis
TECHNICAL INDICATORS
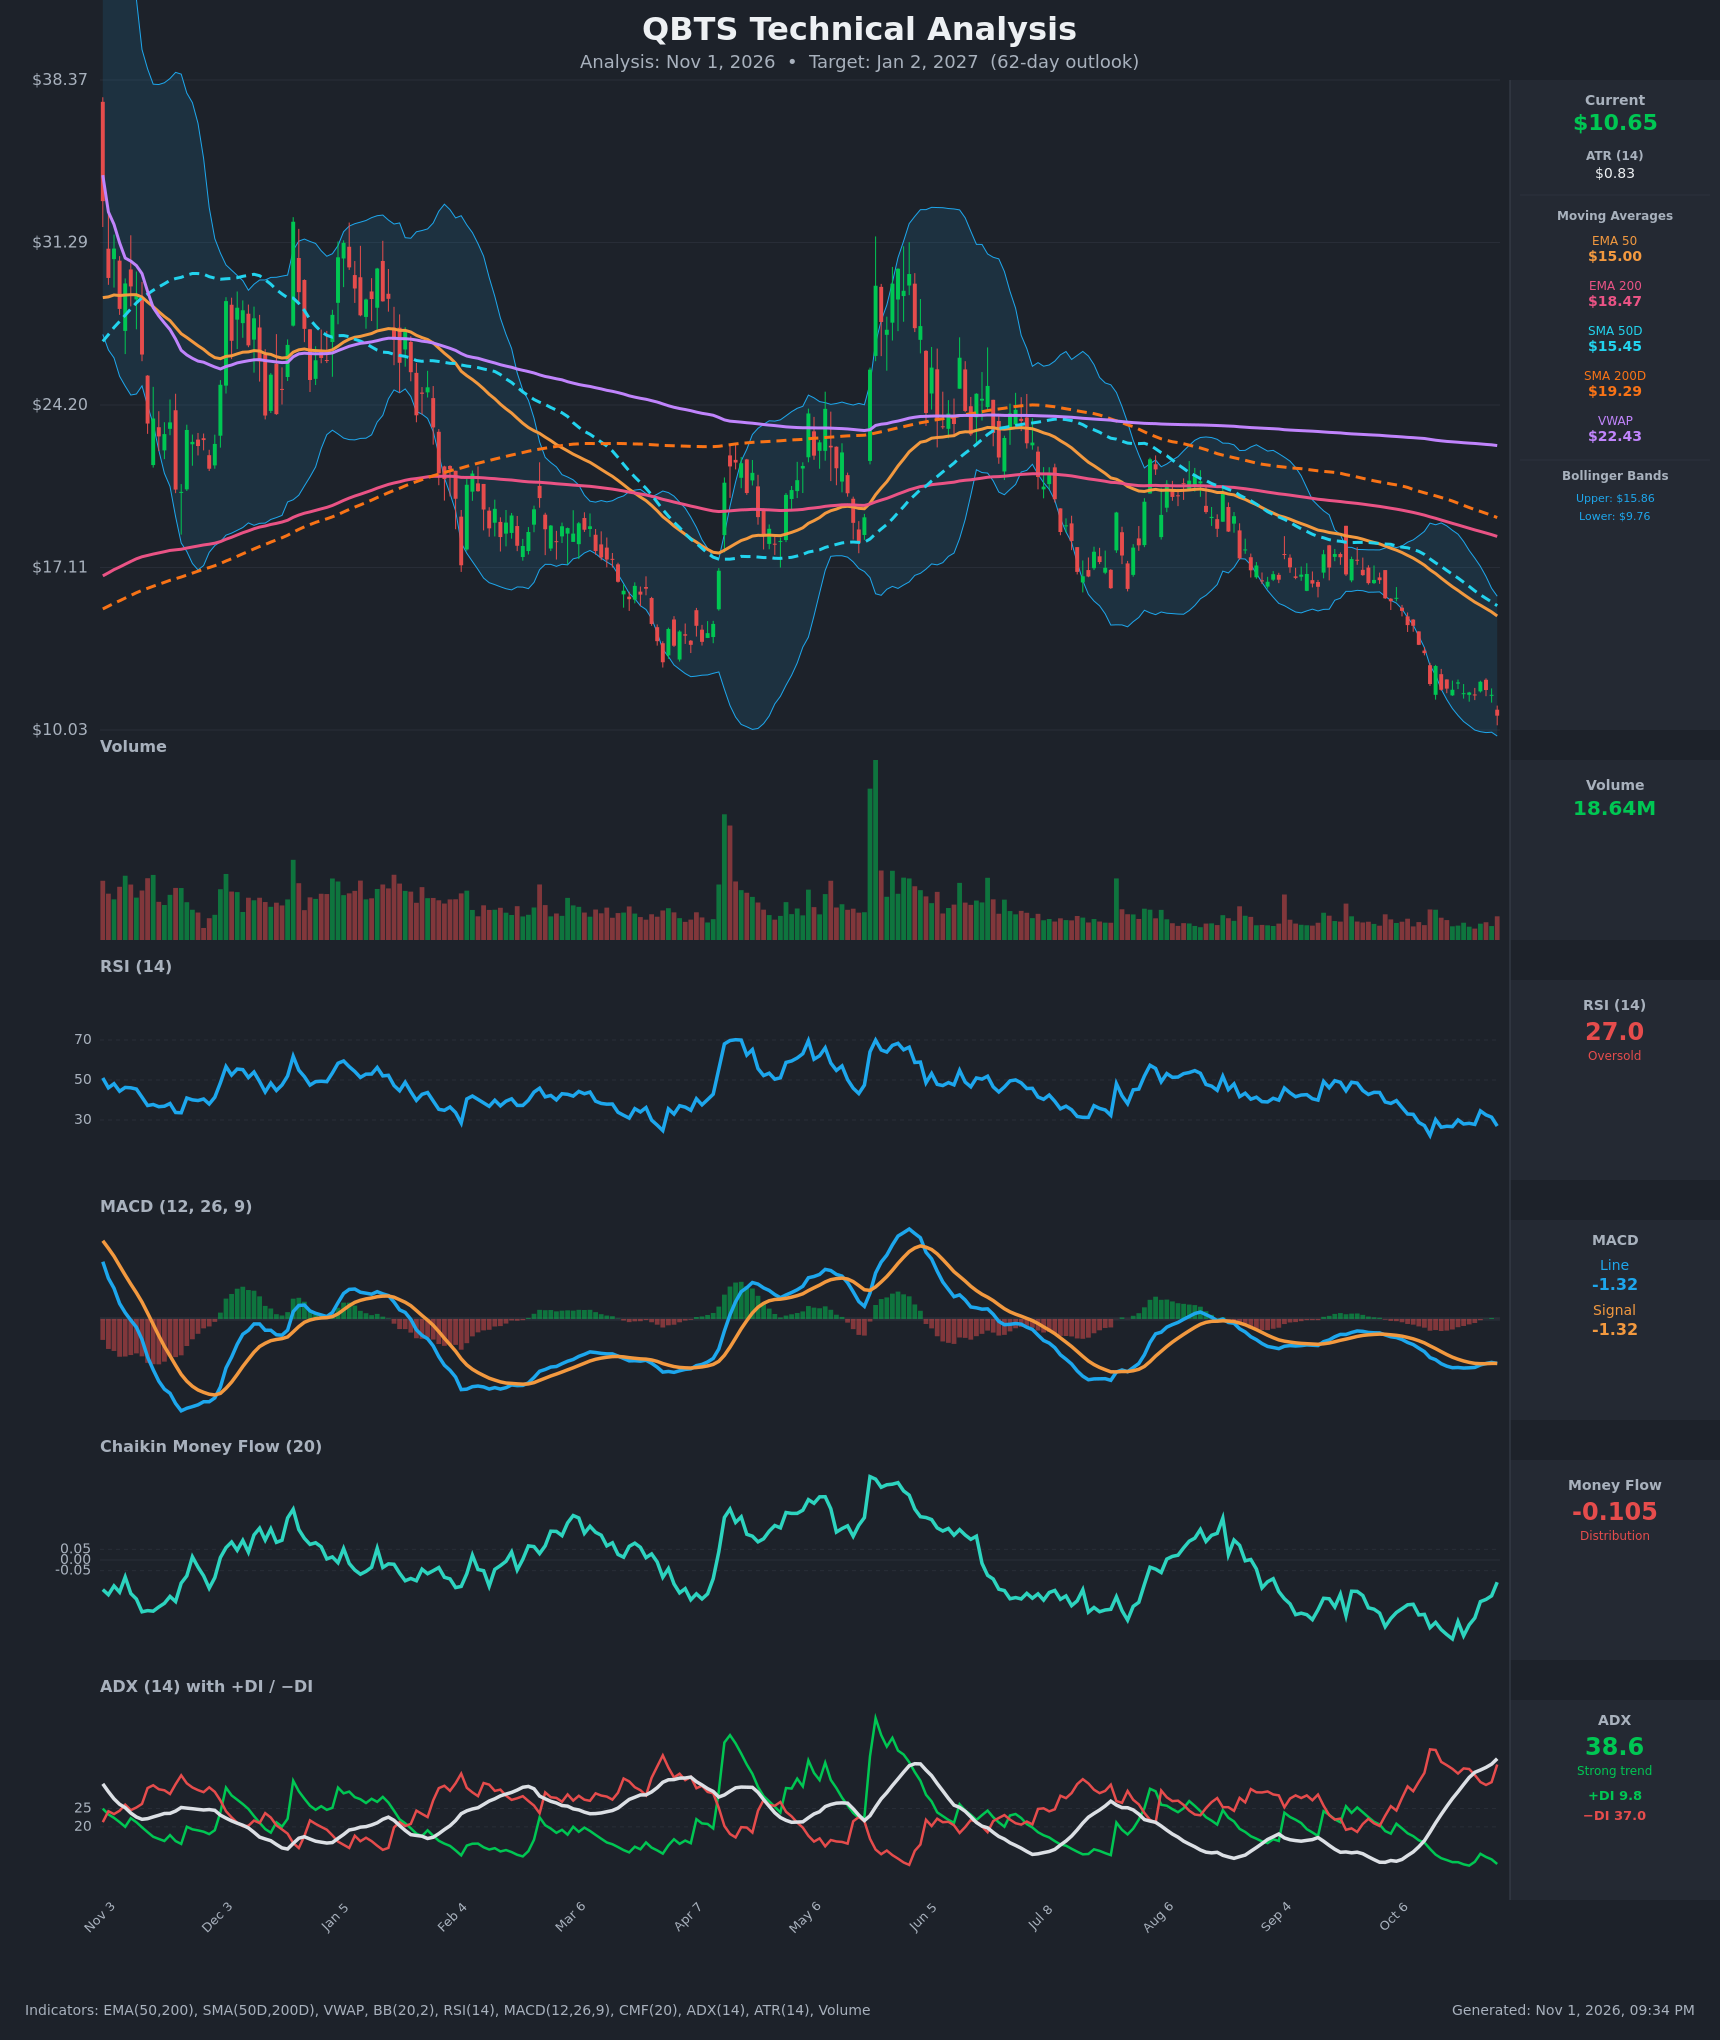
- RSI (14): 26.98, back in oversold territory after a bounce to 34.6 on Oct 27 failed. The series of lower highs (30 → 34.6 → 27) shows momentum still pointing down, though the oversold reading raises the odds of a relief bounce. [Bearish]
- 20 EMA: The 20 EMA isn't supplied. The EMA 50 ($15.00) and the Bollinger midline (about $12.8) both sit well above the $10.65 price, so price is under overhead resistance at every short- and medium-term average. [Bearish]
- MACD: Line -1.322 against signal -1.320, a flat/marginal cross after the line had been above the signal for several sessions. The histogram has shrunk to about zero, so momentum is neither accelerating down nor recovering, and the fresh drop to $10.65 tilts it back toward a bearish cross. [Bearish]
- Bollinger Bands (20): Upper $15.86, lower $9.76, midline about $12.81. Price at $10.65 sits in the lower fifth of the band, close to the lower band after the -7.9% drop on Oct 30. The bands are wide and the lower band is trending down. This is a band walk in a downtrend, and the price is also sitting at the bottom of the chart's visible range. [Bearish]
- CMF (20): -0.105, below the -0.05 threshold. It has improved from -0.371 (Oct 20) but is still in distribution. [Distribution]
- ADX (14): 38.6 and rising, with −DI (37.0) far above +DI (9.8). This is a strong, mature downtrend with sellers firmly in control. The ADX is high enough that an exhaustion bounce is possible. [Strong Trend – Bearish]
- Volume: 18.64M on the Oct 30 down bar, which is above recent average volume. The decline has been on moderate-to-light volume, but this latest bar adds selling pressure with a breakdown below the $11.5 consolidation floor. [Bearish confirmation]
DIVERGENCES & TRENDS
- Moving average structure: Price ($10.65) is below EMA50 ($15.00), EMA200 ($18.47), SMA50D ($15.45), SMA200D ($19.29) and VWAP ($22.43). EMA50 is below EMA200 and SMA50D is below SMA200D, so the death cross has already happened and the long-term trend is bearish.
- Stacked resistance: Every average is falling, which keeps overhead supply heavy.
- CMF: It has been improving from the -0.37 area while price moved sideways to lower. This is a mild bullish divergence, but it is still in distribution territory and was not confirmed by the latest breakdown.
- RSI: It made a lower high on the Oct 27 bounce (34.6), and RSI never reclaimed 40, which is typical bear-market behavior.
- ADX/DI: −DI has stayed far above +DI, and the ADX is climbing steadily. The trend is accelerating rather than fading.
- Breakdown: Price fell out of the $11.5–$12.1 consolidation on Oct 30, closing at a fresh low.
CHART PATTERNS
- Sideways consolidation, then breakdown: The $11.5–$12.1 range of the last two weeks acted like a small Bearish Pennant / Flag within a larger downtrend, and its break lower on Oct 30 is the pattern's bearish resolution. The measured move is roughly the prior pole (about $13.7 → $11.8 = $1.9), which points to $9.7 from the breakdown.
- Larger structure: A Descending Triangle / lower-high sequence from the May peak, with a series of lower highs and lower lows, is a continuation of the bearish trend. There is no visible support structure below the current price, because price is at multi-month lows.
- Caveat: RSI near 27 and price at the lower Bollinger Band make a short-term bounce probable, but a bounce into the $12–$13 area would likely be met with sellers (the failed breakdown retest zone and the Bollinger midline).
POTENTIAL SCENARIOS
- Scenario 1: Bearish Trend Continuation — Price keeps making lower lows along the lower Bollinger Band and below the broken $11.5 floor, with −DI dominant and every moving average acting as resistance. Trigger: sustained closes below $9.76 (lower band), MACD turning down again. Target: $8.00–$9.00. Invalidation: daily close above $13.00 (Bollinger midline and the breakdown zone). (50% probability)
- Scenario 2: Bullish Oversold Relief Bounce, Then Fade — RSI below 30, a compressed MACD and improving CMF lead to a relief rally toward the $12.5–$13.5 area, followed by rejection near the descending 50-day averages. Price ends the 62 days modestly lower or around the starting level. Trigger: reclaim of $11.80 with RSI above 40. Target: $12.50–$13.50. Invalidation: loss of $9.76 on rising volume. (30% probability)
- Scenario 3: Neutral Basing Range — Price stabilizes between roughly $9.50 and $12.50 for the 62 days as selling exhausts. Trigger: ADX rolling over from 38 with +DI/−DI converging. Target: about $10.50–$11.50. Invalidation: a close outside $9.00–$13.00. (20% probability)
PRICE TARGETS
- Target Price: $9.60 (62-day timeframe; downtrend bias with a likely oversold bounce along the way)
- Expected Range: $7.60 to $12.90 (width $5.30, about 49.8% of current price)
- Key Levels: Support at $9.76 (lower Bollinger Band; $9.00 secondary), Resistance at $12.13 (recent consolidation high; $12.81 Bollinger midline)
Self-check: the 62-day range is wider than the guidance of 18–30% because QBTS is a very high-volatility name, and the ATR is $0.83 (about 7.8% of price). On that basis the range is justified: 62 trading-day volatility is far larger than the standard guidance for a typical stock, and the downside range reflects potential continued momentum.
OVERALL BIAS
OVERALL BIAS: BEARISH - Price sits below every moving average and VWAP after a death cross, ADX is 38.6 with −DI (37.0) dominating +DI (9.8), CMF shows distribution, and price broke below its $11.5 consolidation floor on elevated volume. Oversold RSI (27) makes a bounce likely along the way, but rallies should meet heavy overhead resistance.
This is educational analysis and not financial advice.