ORCL 62-day bearish forecast — Nov 1, 2026
- Bias: Bearish
- Timeframe: 62 days (made Nov 1, 2026, target date Jan 1, 2027)
- Price at analysis: $130.67
- Price target: $124.50
- Expected range: $112.00 – $143.00
- Result: Pending — graded after the close on Jan 1, 2027
Get a free AI analysis of ORCL today
Analysis
TECHNICAL INDICATORS
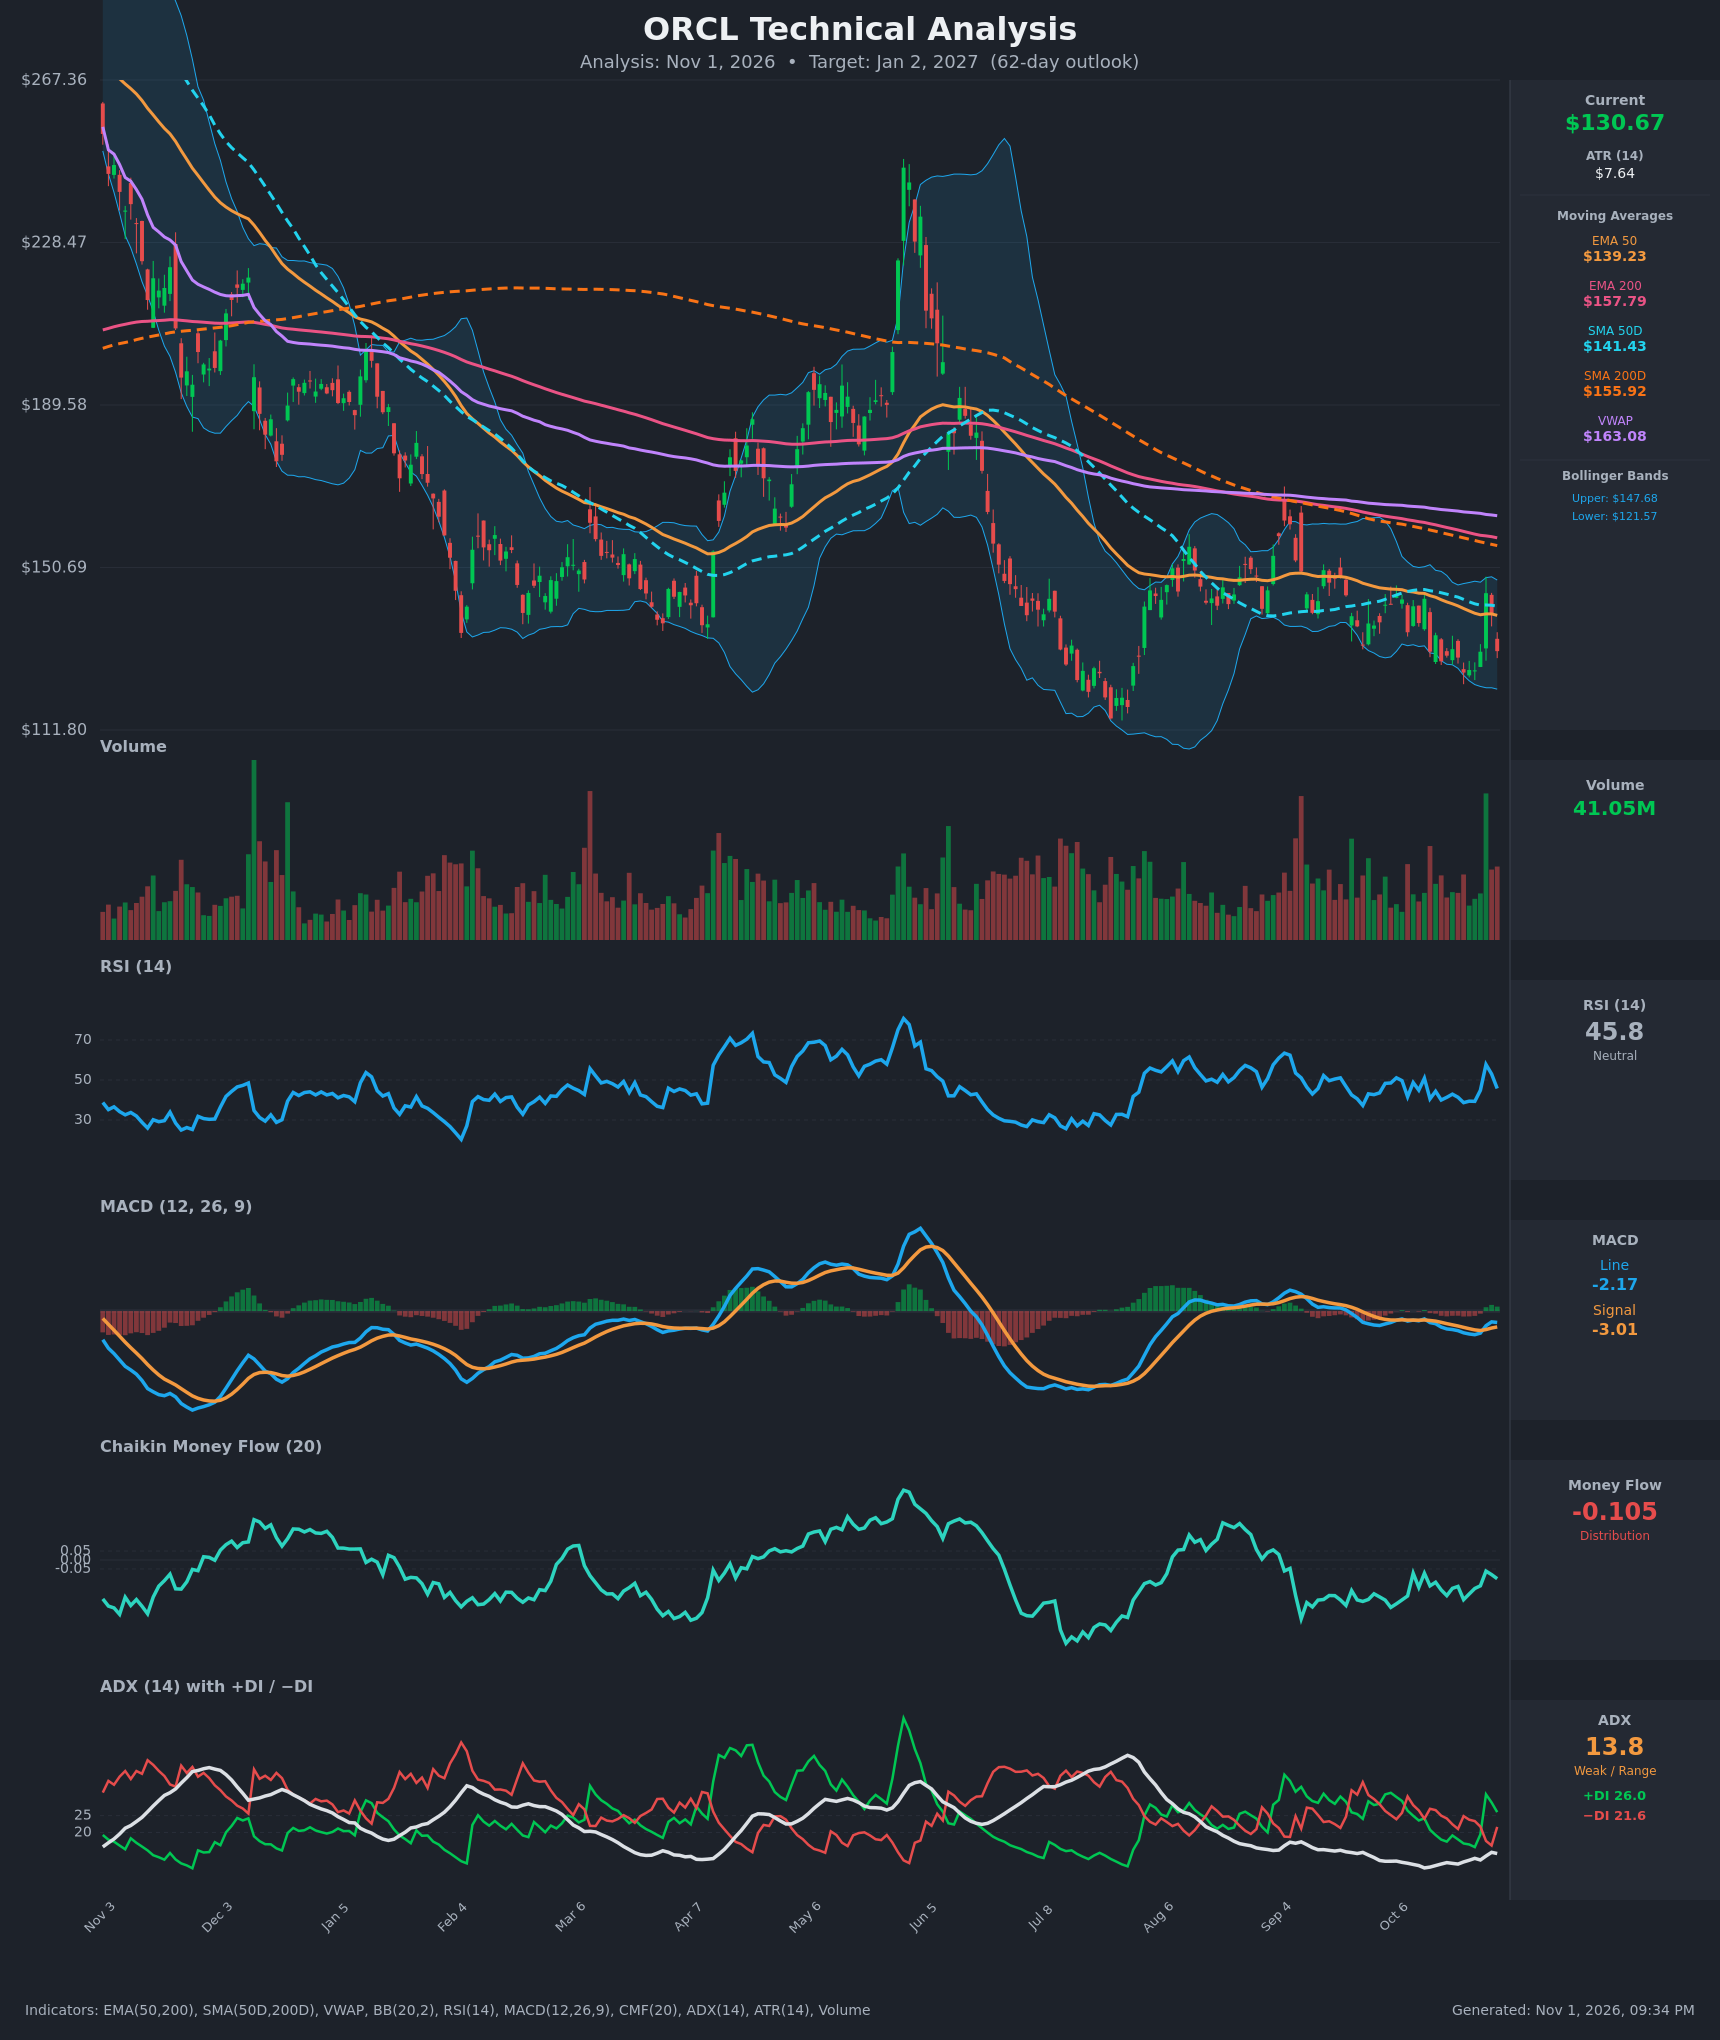
- RSI (14): 45.76, neutral and sitting below 50. It spiked to 57.8 on the Oct 28 pop and has faded back, so the bounce lacked follow-through. It has not reached oversold, so there is room to fall further. [Neutral]
- 20 EMA: Not supplied. The EMA 50 ($139.23) and the BB midline (~$134.63) both sit above price, so rallies are meeting resistance. Price is below the EMA 50 ($139.23), EMA 200 ($157.79), SMA 50 ($141.43) and SMA 200 ($155.92). [Bearish]
- MACD: Line -2.17 is above the signal at -3.01, a small bullish crossover on Oct 28 with a slightly positive histogram. Both lines are still well below zero, so this looks like a relief bounce inside a downtrend rather than a trend change. The line has also flattened since Oct 29, and the histogram is not expanding. [Neutral]
- Bollinger Bands (20): Upper $147.68, lower $121.57, midline ~$134.63. Price at $130.67 is in the lower half, below the midline, after tagging the upper band area on Oct 28 ($144.54) and being rejected. The bands are fairly narrow for this stock, which fits a low-trend grind. Bounces fail at the midline or upper band. [Bearish]
- CMF (20): -0.105, below the -0.05 threshold and negative for nearly the whole recent stretch. Even the Oct 28 spike only lifted it to -0.062. That points to persistent distribution. [Distribution]
- ADX (14): 13.8, weak and range-bound, and it has been below 15 for weeks. +DI (26.0) is back above -DI (21.6) after the Oct 28 spike, but that gap is driven by one large green candle and is fading (+DI 31.3 → 26.0). [Weak Trend, slight bullish DI lean]
- Volume: 41.05M on the latest bar, well above the typical level for the last few months. The Oct 28 surge came on very high volume but was sold into within two sessions (close $144.54 → $130.67). That is a classic failed breakout or bull-trap signature. [Selling into strength, bearish]
DIVERGENCES & TRENDS
- Moving averages: A death cross is already in place (SMA 50 under SMA 200 and EMA 50 under EMA 200), and both gaps are still wide. Price is roughly 16% below the SMA 200 and about 20% below VWAP ($163.08), which signals a long-term downtrend with sellers in control.
- Lower highs: The rally highs have stepped down from ~$150-155 in Aug/Sep to $144.54 in late Oct. Price has made a lower low in the $125-126 area, close to the earlier lows.
- MACD vs price: The MACD bullish crossover has not been confirmed by price, which has already given back the entire Oct 28 gain. There is no clear RSI or MACD bullish divergence; momentum is simply flat-to-weak.
- CMF: It stays below zero while price chops sideways, so volume flow is weaker than price, a mild bearish divergence.
- ADX: It is near cycle lows (~14), so the market is coiling. A volatility expansion is likely over 62 days, and the long-term trend suggests the downside is more likely.
CHART PATTERNS
- Primary read: The price action since Aug resembles a Descending Triangle / bearish rectangle. Support is roughly flat in the $125-126 area (Oct 22-26 lows) against lower highs (~$144.5), and a break below carries a bearish bias. The measured move from a ~$19 pattern height (~$144.5 − $125.5) projects to ~$106-107 on a confirmed break. That is an optimistic extension, so I use the July low area (~$112-115) as the more realistic target zone.
- Secondary read: A Bearish Flag/Pennant after the long decline from $267 and the July low. It is not clean, but the low-ADX drift is consistent with continuation lower.
- Invalidation of the bearish patterns: A close above ~$145 with volume would turn this into a Bullish Double Bottom / range-bound base, with a first target near the SMA 200 at ~$156.
POTENTIAL SCENARIOS
- Scenario 1: Bearish Breakdown of the Range — Rallies fail near the EMA 50/SMA 50 (~$139-141) and price breaks the $125.50 support, with CMF staying negative. Distribution continues and price drifts toward the July lows. Trigger: daily close below $125.50. Target: $112-118 (with a more modest drift to ~$124 likely at the 62-day mark). Invalidation: daily close above $145. (50% probability)
- Scenario 2: Neutral Range Chop — ADX stays weak and price oscillates between ~$125 and ~$145 around the BB midline. Trigger: failure to break either $125.50 or $144.50. Target: $128-138. Invalidation: close outside the $125-145 range. (28% probability)
- Scenario 3: Bullish Reversal Rally — The MACD crossover follows through, +DI stays on top, and price reclaims the EMA 50/SMA 50 on strong volume. Trigger: close above $144.54, then $147.68. Target: $155-157 (SMA 200/EMA 200 zone). Invalidation: close back below $130. (22% probability)
PRICE TARGETS
Range width check: $143.00 − $112.00 = $31.00, which is 23.7% of $130.67. That fits the 18-30% guidance for 61-180 days.
- Target Price: $124.50 (62-day, about 4.7% below current)
- Expected Range: $112.00 to $143.00
- Key Levels: Support at $125.50, Resistance at $139.23
OVERALL BIAS
OVERALL BIAS: BEARISH - Price sits below every major moving average after a completed death cross. CMF shows persistent distribution, and the Oct 28 high-volume spike was sold immediately, leaving lower highs against flat support at ~$125.50. The weak ADX and the fresh MACD crossover temper conviction, but the evidence tilts toward a drift lower or a break of support.
This is educational analysis and not financial advice.