SPY 62-day bearish forecast — Nov 1, 2026
- Bias: Bearish
- Timeframe: 62 days (made Nov 1, 2026, target date Jan 1, 2027)
- Price at analysis: $755.72
- Price target: $742.00
- Expected range: $685.00 – $822.00
- Result: Pending — graded after the close on Jan 1, 2027
Get a free AI analysis of SPY today
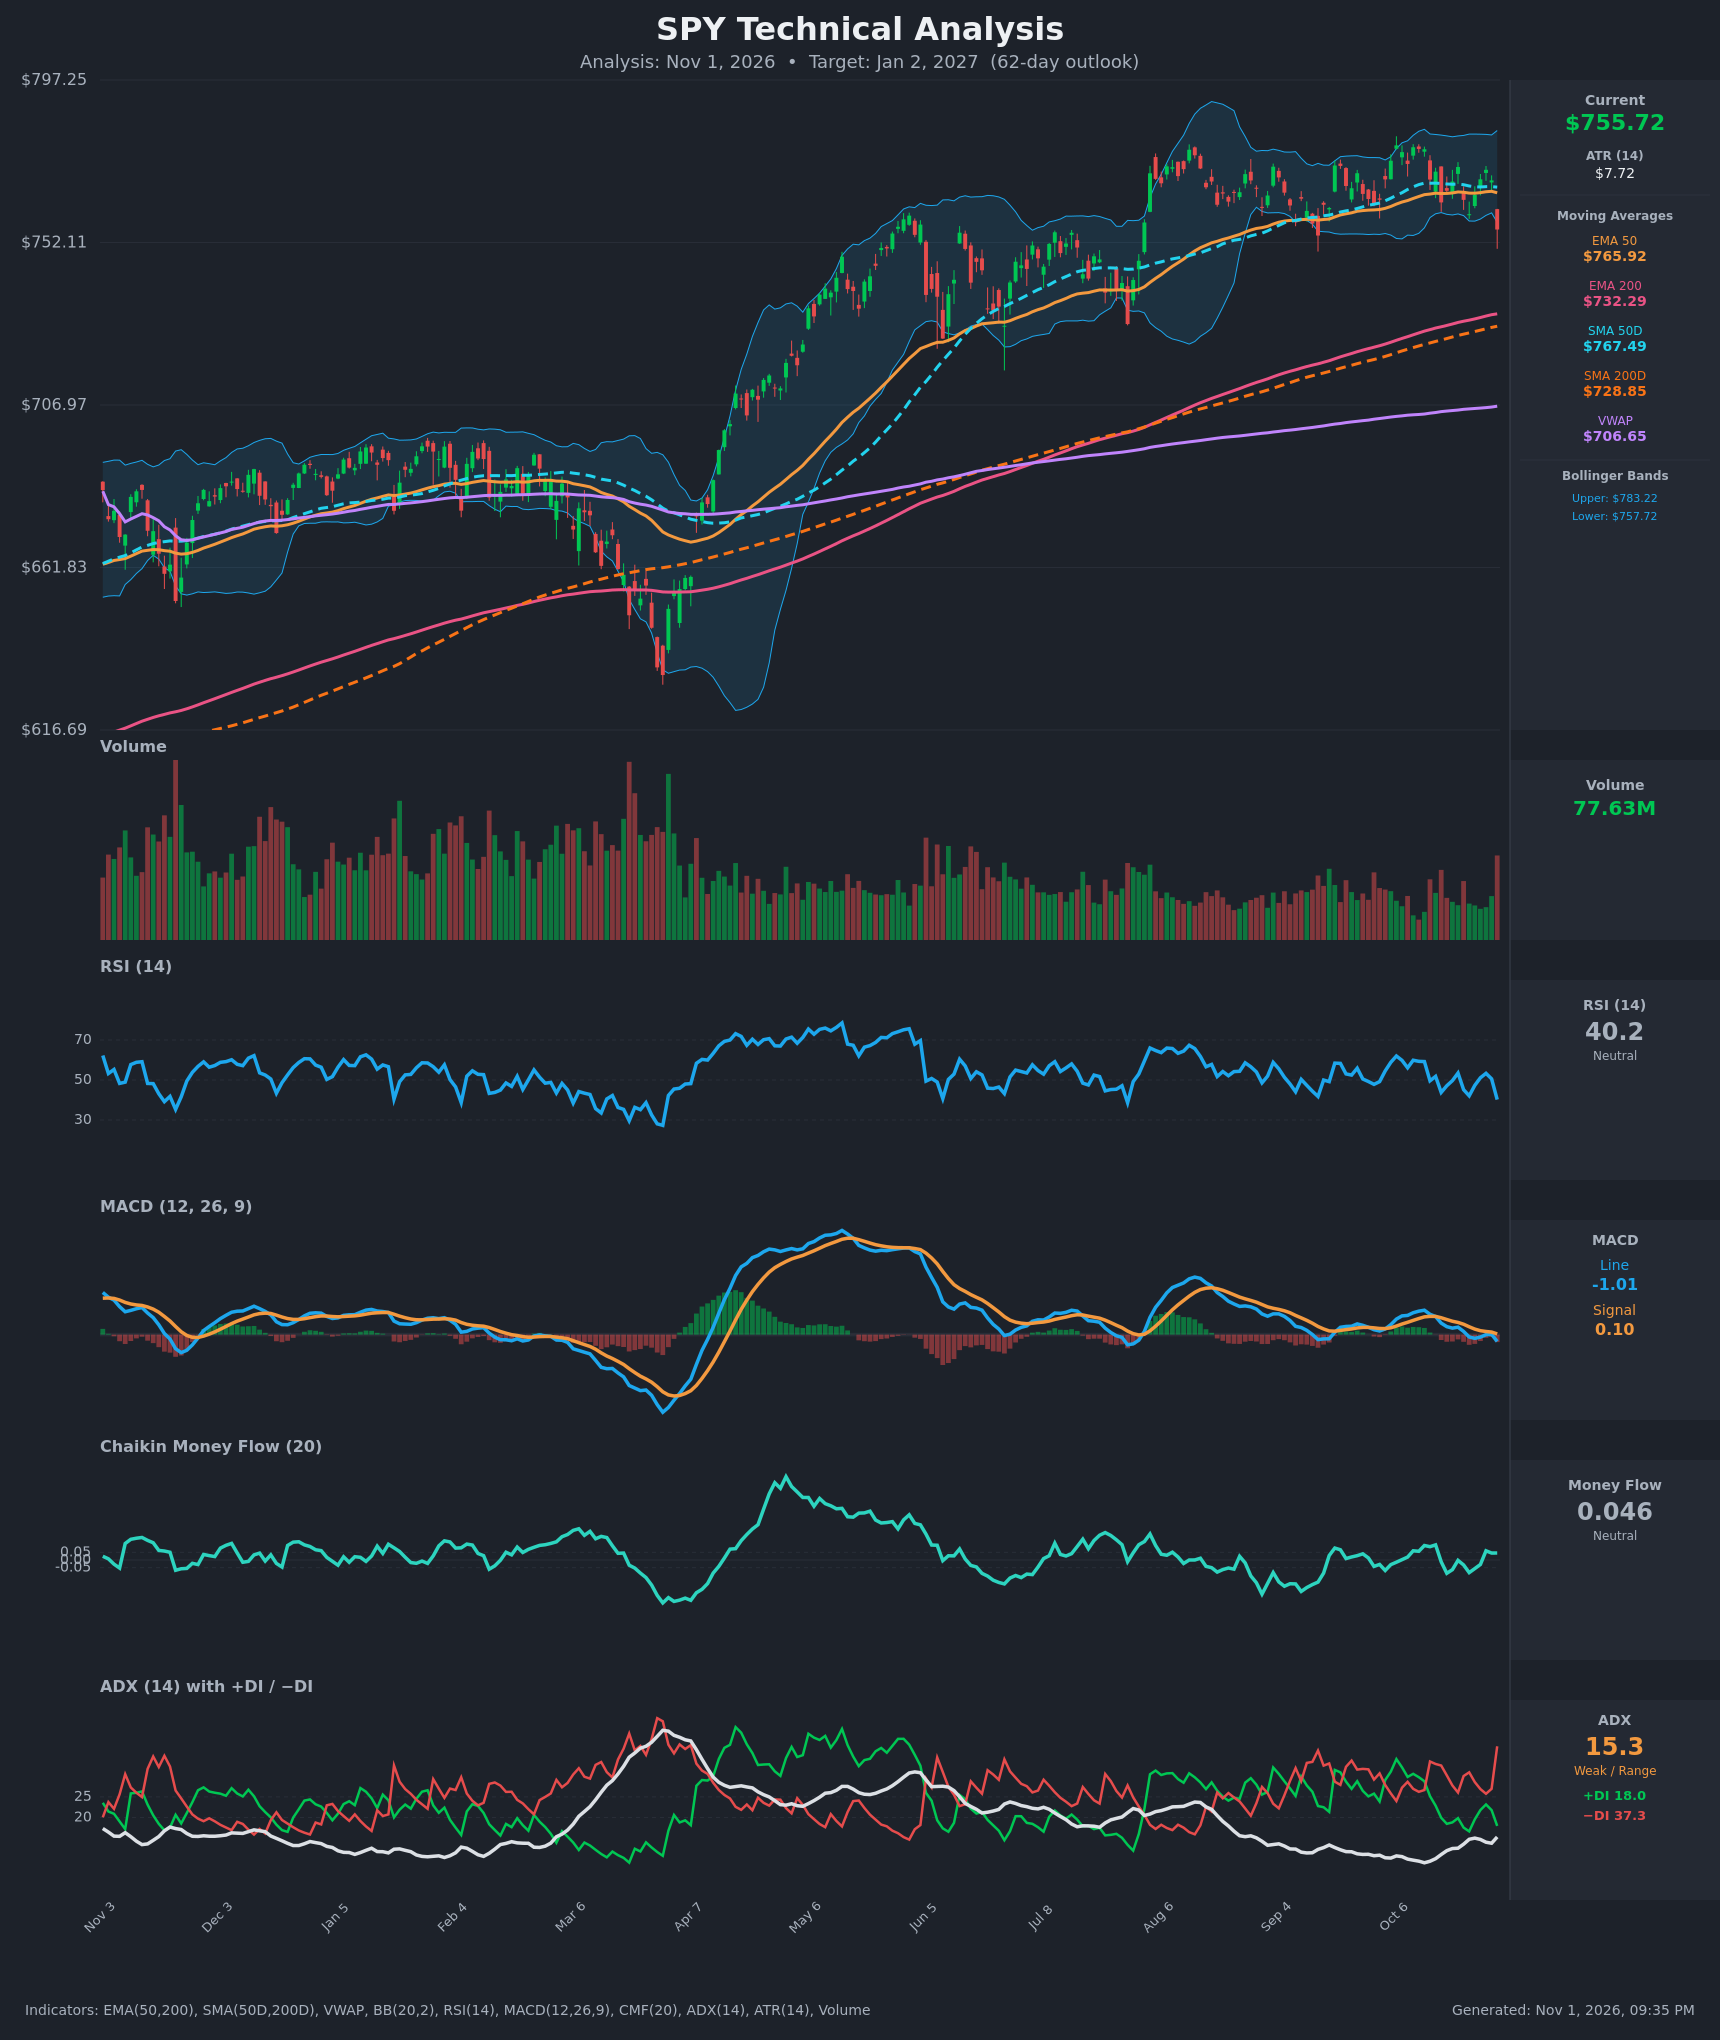
Analysis
TECHNICAL INDICATORS
- RSI (14): 40.2, down sharply from 50.6 a day earlier. It is below the 50 midline but well above oversold (30), so there is room for more downside. Momentum is rolling over. [Bearish]
- 20 EMA / MAs: The 20 EMA is not provided, so I use the EMA 50 at $765.92 and the SMA 50D at $767.49, which price closed below on Oct 30. They now act as overhead resistance. Price is still well above the EMA 200 ($732.29) and SMA 200D ($728.85), so the long-term trend is intact, and the golden cross (SMA50 above SMA200) remains in force. [Bearish short-term / Bullish long-term]
- MACD: The line is -1.01 against a signal of 0.10, a fresh bearish crossover (the line crossed below the signal around Oct 23-28). The histogram is negative and widening, and the line has slipped below zero. [Bearish]
- Bollinger Bands (20): The bands span $757.72 to $783.22. The $755.72 close is below the lower band, a breakdown from the band after weeks of riding the middle band. This can mean a short-term oversold bounce or the start of band-walking lower. The bands are fairly narrow, so volatility is compressed and this move is notable. [Bearish]
- CMF (20): 0.046, just under the +0.05 accumulation threshold and fading from 0.095 in mid-October. Money flow is neutral and slipping. [Neutral]
- ADX (14): 15.3 with −DI at 37.3 above +DI at 18.0. The trend is weak, but the directional pressure is clearly with sellers, and the gap widened sharply on the last bar. ADX is just starting to rise from a low base. [Weak Trend, Bearish direction]
- Volume: 77.63M, the heaviest bar in months, on a red candle that broke below the band. Volume has been declining through the range, so this expansion on a down move shows real distribution. [Bearish]
DIVERGENCES & TRENDS
- There is no clear bullish or bearish RSI divergence. RSI made lower highs, roughly 62, then 58, then 53, while price pushed marginally higher through Oct. That is a mild bearish momentum divergence.
- MACD has been flattening and weakening since August, and it has now crossed below its signal and below zero.
- The −DI/+DI spread has flipped to bearish repeatedly since Oct 14 and now stands at its widest in weeks. ADX is rising off its lows, which can mark the start of a trend.
- Price has moved from above the EMA 50 to below both the EMA 50 and SMA 50D. The 50s are flat, which fits a range-bound market.
- VWAP ($706.65) is far below, and the 200-period averages are rising. These form a layered support zone around $707-$732.
CHART PATTERNS
- Bearish Triple Top / range breakdown: Since August, price has repeatedly failed near the $780-$785 area (the upper Bollinger band) and has held a floor around $757-$760. The close at $755.72 on heavy volume breaks that floor. Measured move: a range height of about $25-$30 projects to roughly $728-$733, which coincides with the EMA 200 and SMA 200D.
- A Bearish Expanding Triangle / rising wedge is a secondary possibility from the choppy higher highs and lower lows. Its target is the same area.
- The broader structure is a rising-MA uptrend, so the long-term support cluster at $728-$732 is the likely landing zone and a place where buyers may defend.
- A close back above $767 would negate the breakdown, making it a failed breakdown or bear trap.
POTENTIAL SCENARIOS
- Scenario 1: Bearish Range Breakdown to the 200-day Cluster — The breakdown is confirmed, price retests $765-$767 from below and fails, then drifts toward the long-term averages. Trigger: daily closes below $755 and failure at the $765-$767 EMA/SMA 50 cluster. Target: $730-$742, first $732 (EMA 200) and then the $728.85 SMA 200D. Invalidation: a daily close above $768. (50% probability)
- Scenario 2: Bullish Failed Breakdown / Mean Reversion — The price below the lower band is a shakeout, and buyers push back into the prior range and toward the upper band. Trigger: reclaim of $758 followed by a close above the $767 SMA 50D with CMF above 0.05. Target: $783-$795. Invalidation: a close below $745. (30% probability)
- Scenario 3: Neutral Choppy Consolidation — Price oscillates between $735 and $775 with weak ADX and no resolution. Trigger: ADX stays below 20 and MACD returns toward zero. Target: $745-$765. Invalidation: a close beyond $730 or $785. (20% probability)
PRICE TARGETS
- Target Price: $742.00 (62 days, about Jan 2, 2027)
- Expected Range: $685.00 to $822.00 (width $137, about 18.1% of current price, consistent with the 61-180 day guidance)
- Key Levels: Support at $732.29, Resistance at $767.49
OVERALL BIAS
OVERALL BIAS: BEARISH - Price broke below the lower Bollinger band on the heaviest volume in months. MACD crossed bearish, −DI (37.3) dominates +DI (18.0), and RSI is falling. The range breakdown projects toward the $730 area, where the rising 200-period averages should provide major support, so the bias is a pullback within a long-term uptrend rather than a collapse.
This is educational analysis and not financial advice.