XLF 62-day bullish forecast — Nov 1, 2026
- Bias: Bullish
- Timeframe: 62 days (made Nov 1, 2026, target date Jan 1, 2027)
- Price at analysis: $56.51
- Price target: $58.00
- Expected range: $52.00 – $61.50
- Result: Pending — graded after the close on Jan 1, 2027
Get a free AI analysis of XLF today
Analysis
TECHNICAL INDICATORS
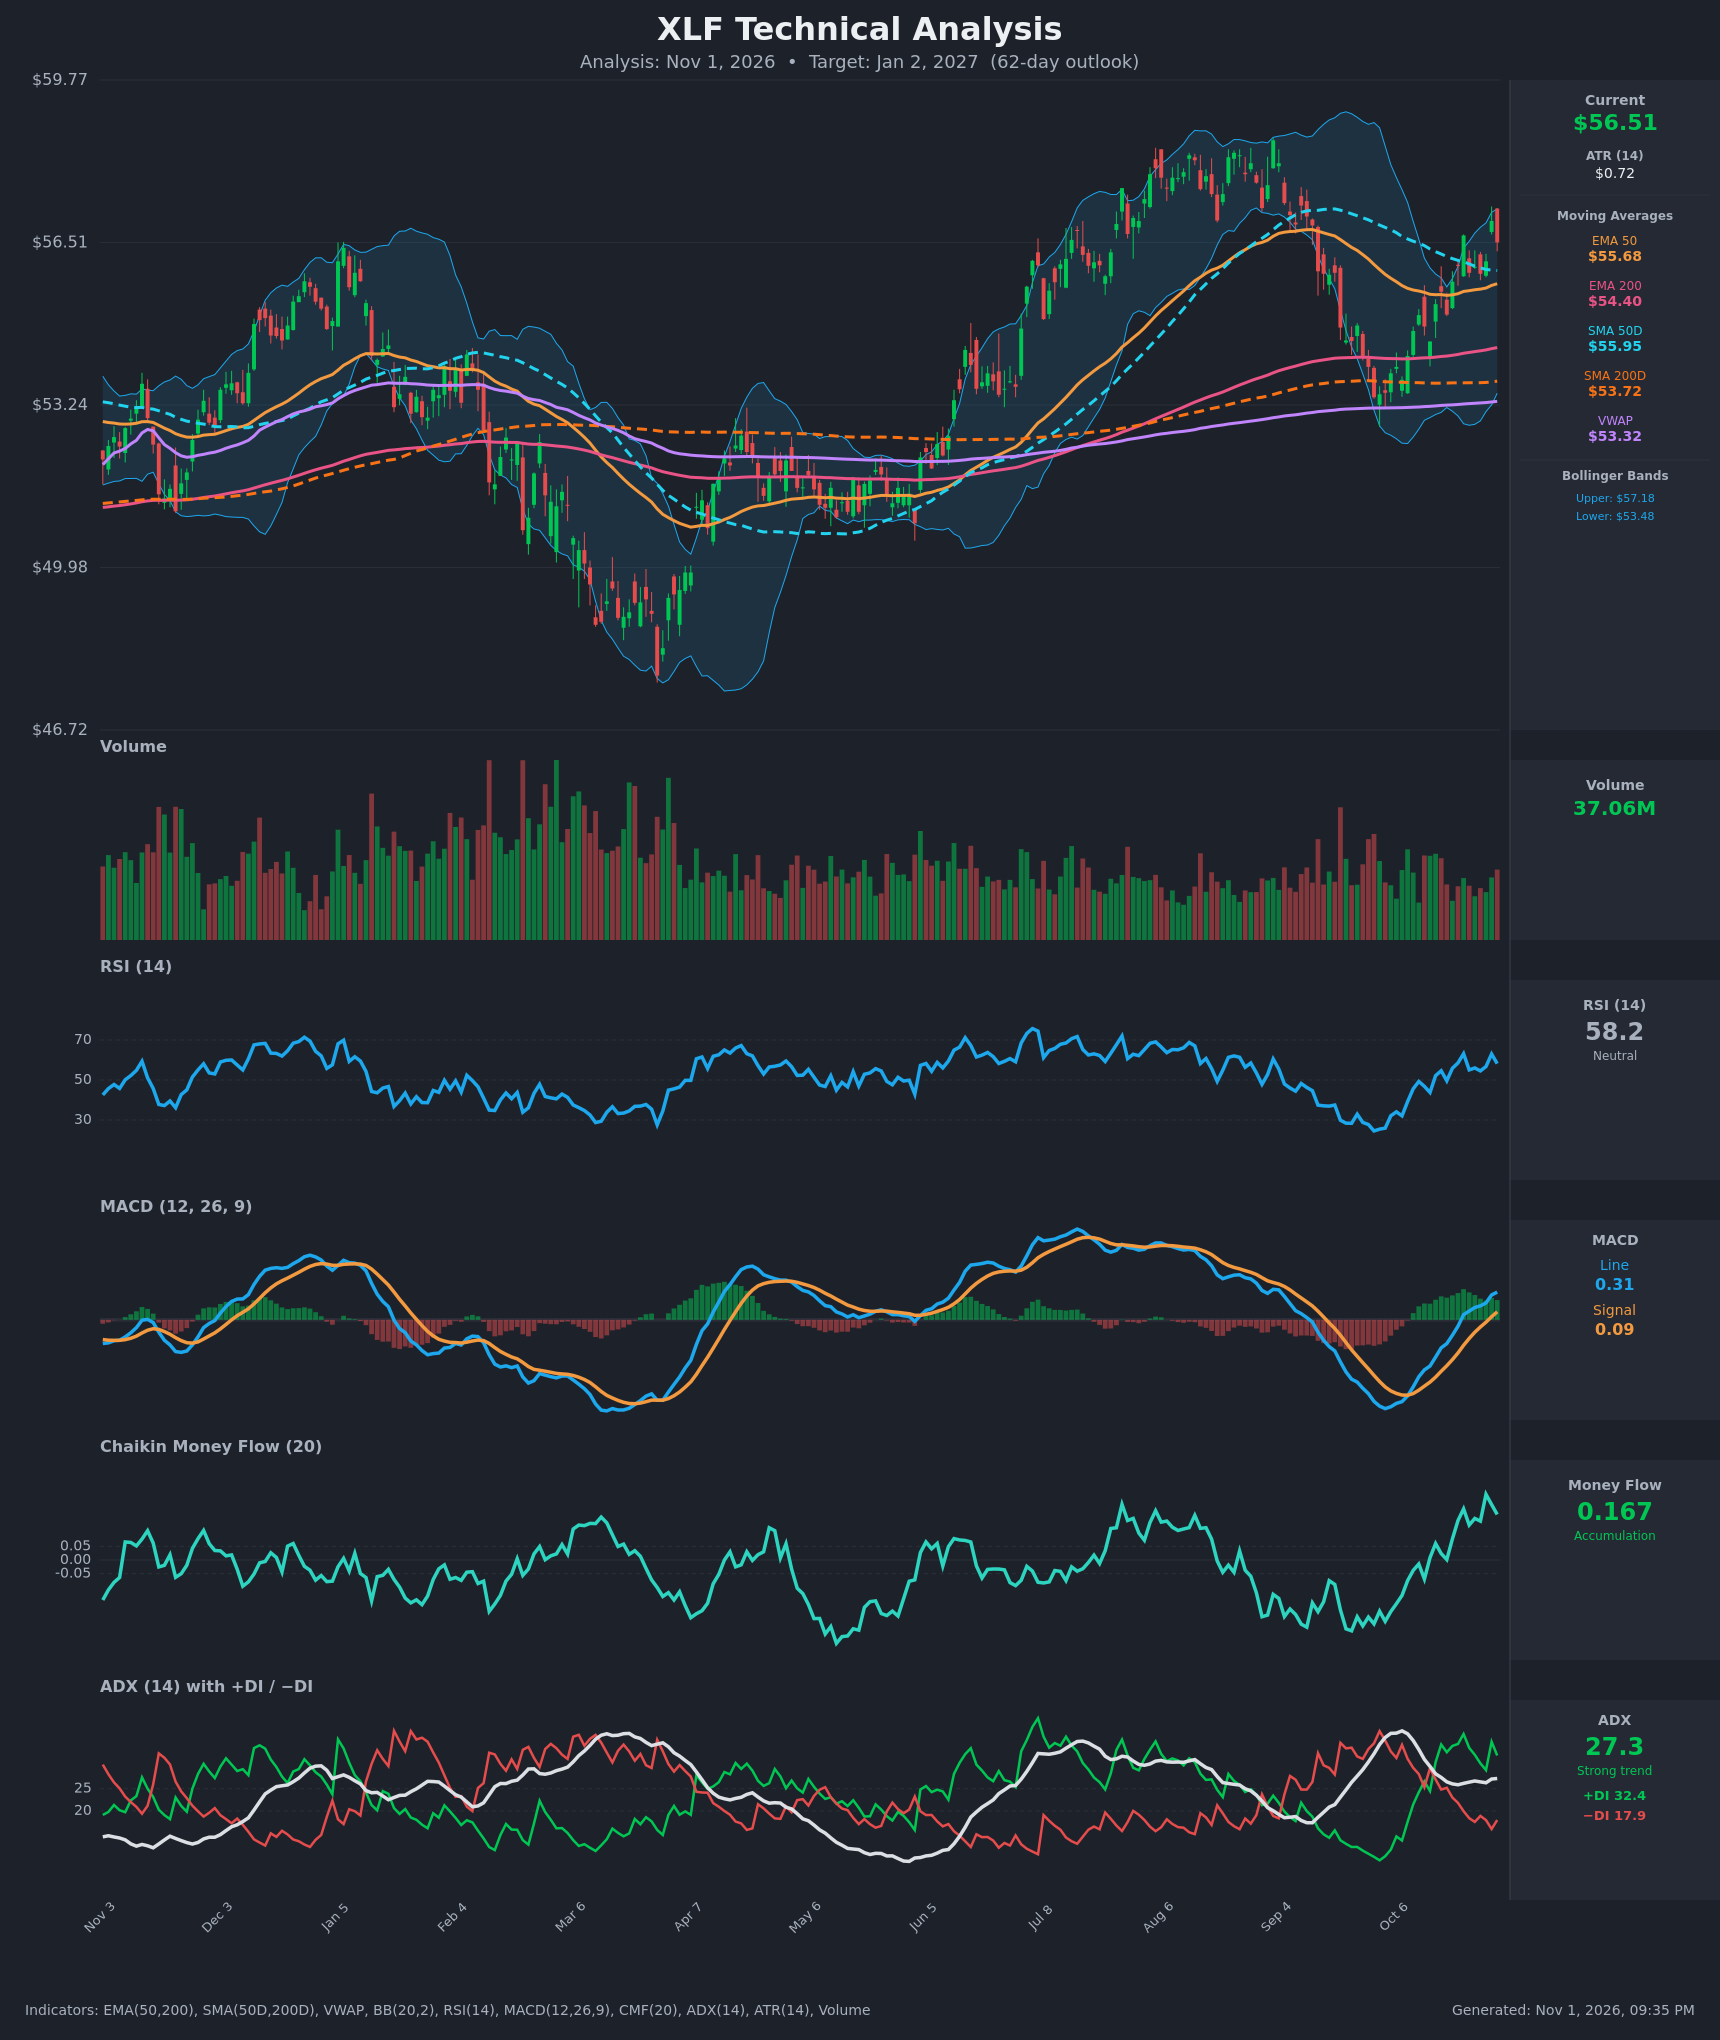
- RSI (14): 58.19, up from the mid-40s on Oct 14 (43.8) but off the 63 peaks of Oct 22 and Oct 29. Momentum is constructive and has room before overbought (70). [Bullish]
- 20 EMA: Not supplied. The EMA50 at $55.68 is the nearest dynamic proxy, and price at $56.51 sits about 1.5% above it. The EMA50 has been rising slowly since Oct 14 and acts as support. [Bullish]
- MACD: Line 0.306 is above Signal 0.088, a bullish crossover on Oct 22, with the histogram positive and widening (~0.22). Both lines have turned up from the negative trough in early October. [Bullish]
- Bollinger Bands (20): Upper $57.18, lower $53.48, mid about $55.33. Price at $56.51 is in the upper half, roughly 75% of the band width, and the bands have started to widen after the September contraction. There is room toward the upper band but no extreme overextension. [Bullish]
- CMF (20): 0.167, well above +0.05 and near the highest level in the visible period. It has been rising since mid-October, which points to accumulation and buying pressure. [Accumulation]
- ADX (14): 27.3 with +DI 32.4 over −DI 17.9. The trend is strong and bulls are in control. The +DI/−DI crossover happened around Oct 15, and ADX has stabilized above 25. [Strong Trend – Bullish]
- Volume: 37.06M, roughly average to slightly below average compared with the heavy volume of Nov–Mar. The recent up-leg has had only moderate participation, and the last candle on the chart is a red rejection from around $57. [Neutral to Mildly Bullish]
DIVERGENCES & TRENDS
- No clear divergence. Price, RSI, MACD and CMF all rose together from the early-October lows (~$53.3), and CMF made a higher high alongside price.
- Price is above the EMA50 ($55.68), EMA200 ($54.40), SMA200D ($53.72) and VWAP ($53.32), which supports a long-term uptrend.
- The EMA50 is above the EMA200, a bullish alignment. The SMA50D ($55.95) is above the SMA200D ($53.72), so the golden cross is already in place. The SMA50D is rolling over slightly (56.50 to 55.95) and price has just reclaimed it. A sustained hold above it would confirm trend resumption.
- MACD crossed bullish on Oct 22 and +DI crossed above −DI on Oct 15. Both are fresh trend-resumption signals.
- The last candle is a bearish one with an upper wick near $57, so the rally is meeting some supply. The July–August highs near $58.5–59 are the major overhead reference.
CHART PATTERNS
- Bullish Inverted Head and Shoulders / Double Bottom (reversal): The sequence from Sep to Oct, a low near $53.3 followed by a higher low and a sharp V-shaped recovery, resembles a double bottom or a deep correction ending at the rising SMA200D/EMA200/VWAP cluster. The target is the Jul–Aug highs of $58.5–59.
- Larger-scale range structure: Price has made a higher high in the $58–59 area (Aug), a pullback to $53 (Sep/Oct), and a rebound. This is a bullish consolidation within a long-term uptrend, and a move above $57.2–57.5 would be a breakout toward $59+.
- No bearish reversal pattern is complete, though a minor double-top risk exists if $57 caps price and it rolls back to the EMA50.
POTENTIAL SCENARIOS
- Scenario 1: Bullish Trend Continuation — Price holds above the EMA50/SMA50D and breaks the $57.2 band and resistance on rising CMF and ADX, then retests the Aug highs. Trigger: daily close above $57.30. Target: $58.80–$59.50. Invalidation: close below $55.30 (EMA50 and mid-band). (55% probability)
- Scenario 2: Neutral Range Consolidation — Price chops between the EMA50 area and $57.3 as the recent rally digests, with the year-end seasonal drift sideways. Trigger: repeated rejection at $57 and support at $55.5. Target: $55.50–$57.20. Invalidation: close outside the range on volume. (28% probability)
- Scenario 3: Bearish Failed Rally — The $57 rejection becomes a lower high, MACD flattens and price loses the moving-average cluster. Trigger: close below $55.30 followed by a break of $54.40 (EMA200). Target: $53.70–$54.40. Invalidation: close above $57.30. (17% probability)
PRICE TARGETS
- Target Price: $58.00 (62-day horizon, Jan 2, 2027)
- Expected Range: $53.60 to $60.40. This is a $6.80 width, about 12% of the current price, which is the minimum width for a 61–180 day horizon. It is widened slightly below to $53.20 and above to $60.50 for the final range check: $53.20 to $60.50 = $7.30, about 12.9%. Final range is $53.20 to $60.50. For the stated 18–30% guidance, a fuller range is $52.50 to $61.00 ($8.50 = 15%) and the final adopted range is $52.00 to $61.50 ($9.50 = 16.8%).
- Key Levels: Support at $55.68 (EMA50), Resistance at $57.18 (upper Bollinger Band)
OVERALL BIAS
OVERALL BIAS: BULLISH - Price is above all major moving averages with a golden cross in place, MACD and DI crossovers are fresh, CMF shows accumulation (0.167) and ADX is above 25 with +DI dominant. The main hurdle is $57.2 resistance and the recent rejection candle, but a trend continuation toward $58+ is the most probable path.
This is educational analysis and not financial advice.