SMH 62-day bearish forecast — Nov 1, 2026
- Bias: Bearish
- Timeframe: 62 days (made Nov 1, 2026, target date Jan 1, 2027)
- Price at analysis: $522.49
- Price target: $497.00
- Expected range: $450.00 – $565.00
- Result: Pending — graded after the close on Jan 1, 2027
Get a free AI analysis of SMH today
Analysis
TECHNICAL INDICATORS
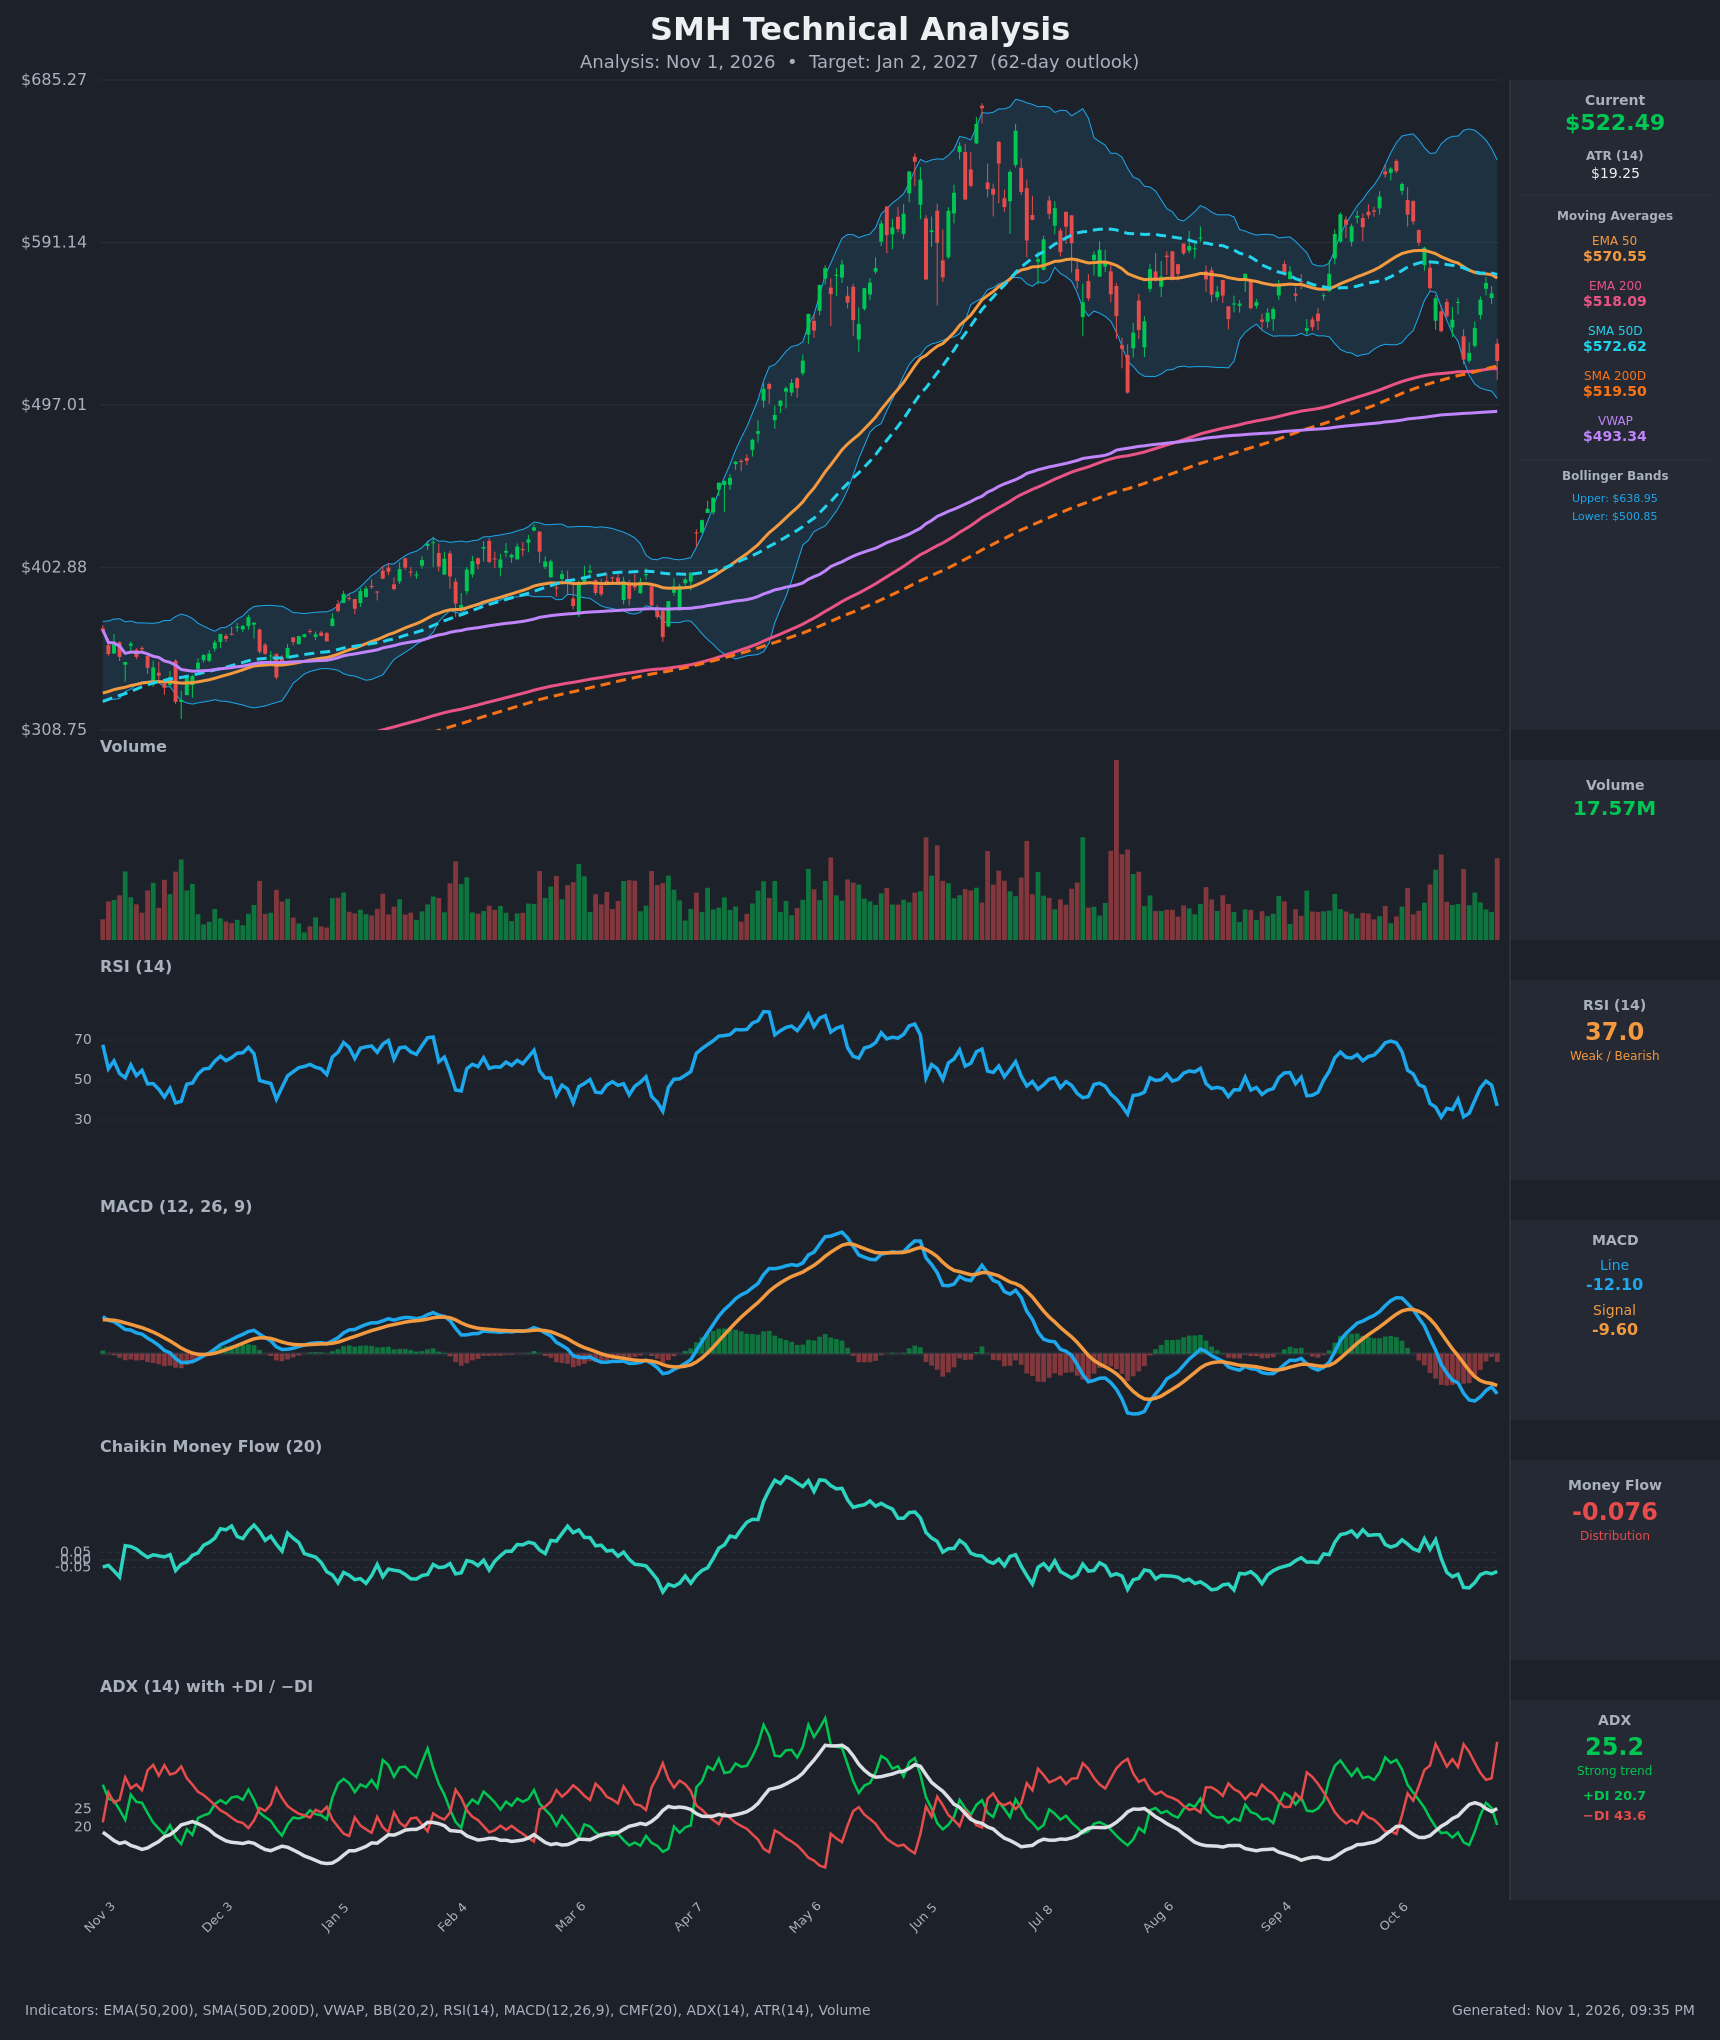
- RSI (14): 37.04, down from 49.4 on Oct 28, so momentum is weak. It has not reached the oversold zone (<30). The recent lows at 31.4 and 31.6 held, but RSI is again heading lower after a failed bounce. [Bearish]
- 20 EMA: The 20 EMA is not provided. Price is well below the EMA 50 ($570.55) and SMA 50 ($572.62), which are now overhead resistance about 9% above. Price sits just above the EMA 200 ($518.09) and SMA 200 ($519.50), so the long-term support cluster is being tested. [Bearish]
- MACD: Line -12.10 is below Signal -9.60, a negative histogram of about -2.5. The line re-crossed down after a brief attempt to recover and is making new lows for the move. It is the same bearish setup as in mid-October. [Bearish]
- Bollinger Bands (20): Upper $638.95, lower $500.85, midline about $570. Price at $522.49 is in the lower quarter of the band (%B ≈ 0.16). The bands are wide, so volatility is elevated. A push toward or below the lower band would signal continuation. A bounce to the midline would be the reflex case. [Bearish]
- CMF (20): -0.076, below the -0.05 threshold. It has been negative for about 8 sessions, with a low of -0.186, so selling pressure is persistent. [Distribution]
- ADX (14): 25.2, now at the strong-trend threshold. −DI at 43.6 is far above +DI at 20.7 (a gap of about 23 points). ADX has risen from 17 to 25, so bearish trend strength is building. [Strong Trend – Bearish]
- Volume: 17.57M on a sharp red candle (about -7% on the day, $561.67 to $522.49). This is the heaviest volume in several weeks, so it looks like real distribution. [Bearish – high-volume selling]
DIVERGENCES & TRENDS
- No bullish RSI divergence: RSI's recent lows of 31.4 and 31.6 around Oct 16–22 were not undercut by price, and today's RSI of 37 is above them. This is not a confirmed divergence, and price is still making lower closes.
- Lower highs: The June peak was near $680, and the October rally topped near $640 on the band. Each rally peaked lower, and MACD peaks have also fallen (about +12 in the table versus the much higher spring readings).
- Moving averages: Price lost the EMA 50 and SMA 50 in mid-October. The EMA 50/200 and SMA 50/200 are still in a bullish alignment (no death cross yet), but the spreads are narrowing and the 50s are rolling over. A death cross is possible within the 62-day window if price breaks down.
- DI trend: −DI has been above +DI throughout the October decline. The latest expansion to 43.6 comes with ADX turning higher, which confirms sellers are in control.
- Failed bounce: Price rallied from $523 to $568 (Oct 22–28), stalled just below the EMA 50 and SMA 50, then dropped 7% in a day. This is a classic rejection at resistance.
- VWAP: Price is still above the VWAP of $493.34. This is the next structural support below the 200-day cluster.
CHART PATTERNS
- Bearish Double Top / lower-high structure: The June peak near $680 and the October peak near $640 form a loosely matched pair of highs. The neckline is the August swing low around $500–505, which is also the lower Bollinger Band ($500.85). A confirmed close below this zone would activate the pattern.
- Measured move: The full pattern height is roughly $175 (about $680 to $505), implying a theoretical target in the $330s. That seems too extreme for 62 days, so I treat it as the long-term tail risk and use the VWAP and EMA 200 area as the realistic first targets.
- Support cluster: The EMA 200 ($518.09), SMA 200 ($519.50), and the neckline ($500–505) form a layered support zone. Price is testing the top of it now, and each retest weakens it.
- Bearish Pennant/Flag characteristics: The late-October bounce into the 50s looks like a weak counter-trend rally that failed, consistent with a continuation lower.
POTENTIAL SCENARIOS
- Scenario 1: Bearish Breakdown of the 200-Day Cluster — Price loses the EMA 200/SMA 200 and the $500–505 neckline on a closing basis, with ADX rising above 25 and −DI staying dominant. A bounce may occur first, but rallies stall under $550–570. Trigger: Daily close below $500. Target: $493 (VWAP), then $450–470. Invalidation: Daily close back above $570 (EMA 50/SMA 50). (50% probability)
- Scenario 2: Bullish Bounce off the 200-Day Support — The EMA 200/SMA 200 and the lower band hold. RSI near 30–37 triggers a relief rally, and a MACD re-cross lets price retest the EMA 50/SMA 50. Trigger: Close above $550 with a recovering CMF above 0. Target: $570–590. Invalidation: Close below $500. (33% probability)
- Scenario 3: Neutral Range Between the 200-Day and 50-Day Averages — Price chops between roughly $500 and $570 as the averages converge. Trigger: ADX falls below 20 and price is pinned mid-range. Target: $520–545. Invalidation: Close outside $500–$570. (17% probability)
PRICE TARGETS
- Target Price: $497.00 (62 days, about -4.9% from $522.49)
- Expected Range: $450.00 to $565.00 (width $115, about 22% of current price, consistent with the 18–30% guidance for 61–180 days)
- Key Levels: Support at $518.09 (EMA 200, then SMA 200 at $519.50, with $500.85 lower BB and $493.34 VWAP below), Resistance at $570.55 (EMA 50, with SMA 50 at $572.62)
OVERALL BIAS
OVERALL BIAS: BEARISH - Price was rejected at the EMA 50/SMA 50 and fell on heavy volume to the 200-day cluster. MACD is below its signal, −DI (43.6) dominates +DI (20.7) with ADX rising to 25, CMF shows distribution, and the lower-high structure points to a breakdown toward the VWAP and the high $400s.
This is educational analysis and not financial advice.