AAPL 76-day bullish forecast — Nov 1, 2026
- Bias: Bullish
- Timeframe: 76 days (made Nov 1, 2026, target date Jan 15, 2027)
- Price at analysis: $344.63
- Price target: $356.00
- Expected range: $318.00 – $380.00
- Result: Pending — graded after the close on Jan 15, 2027
Get a free AI analysis of AAPL today
Analysis
TECHNICAL INDICATORS
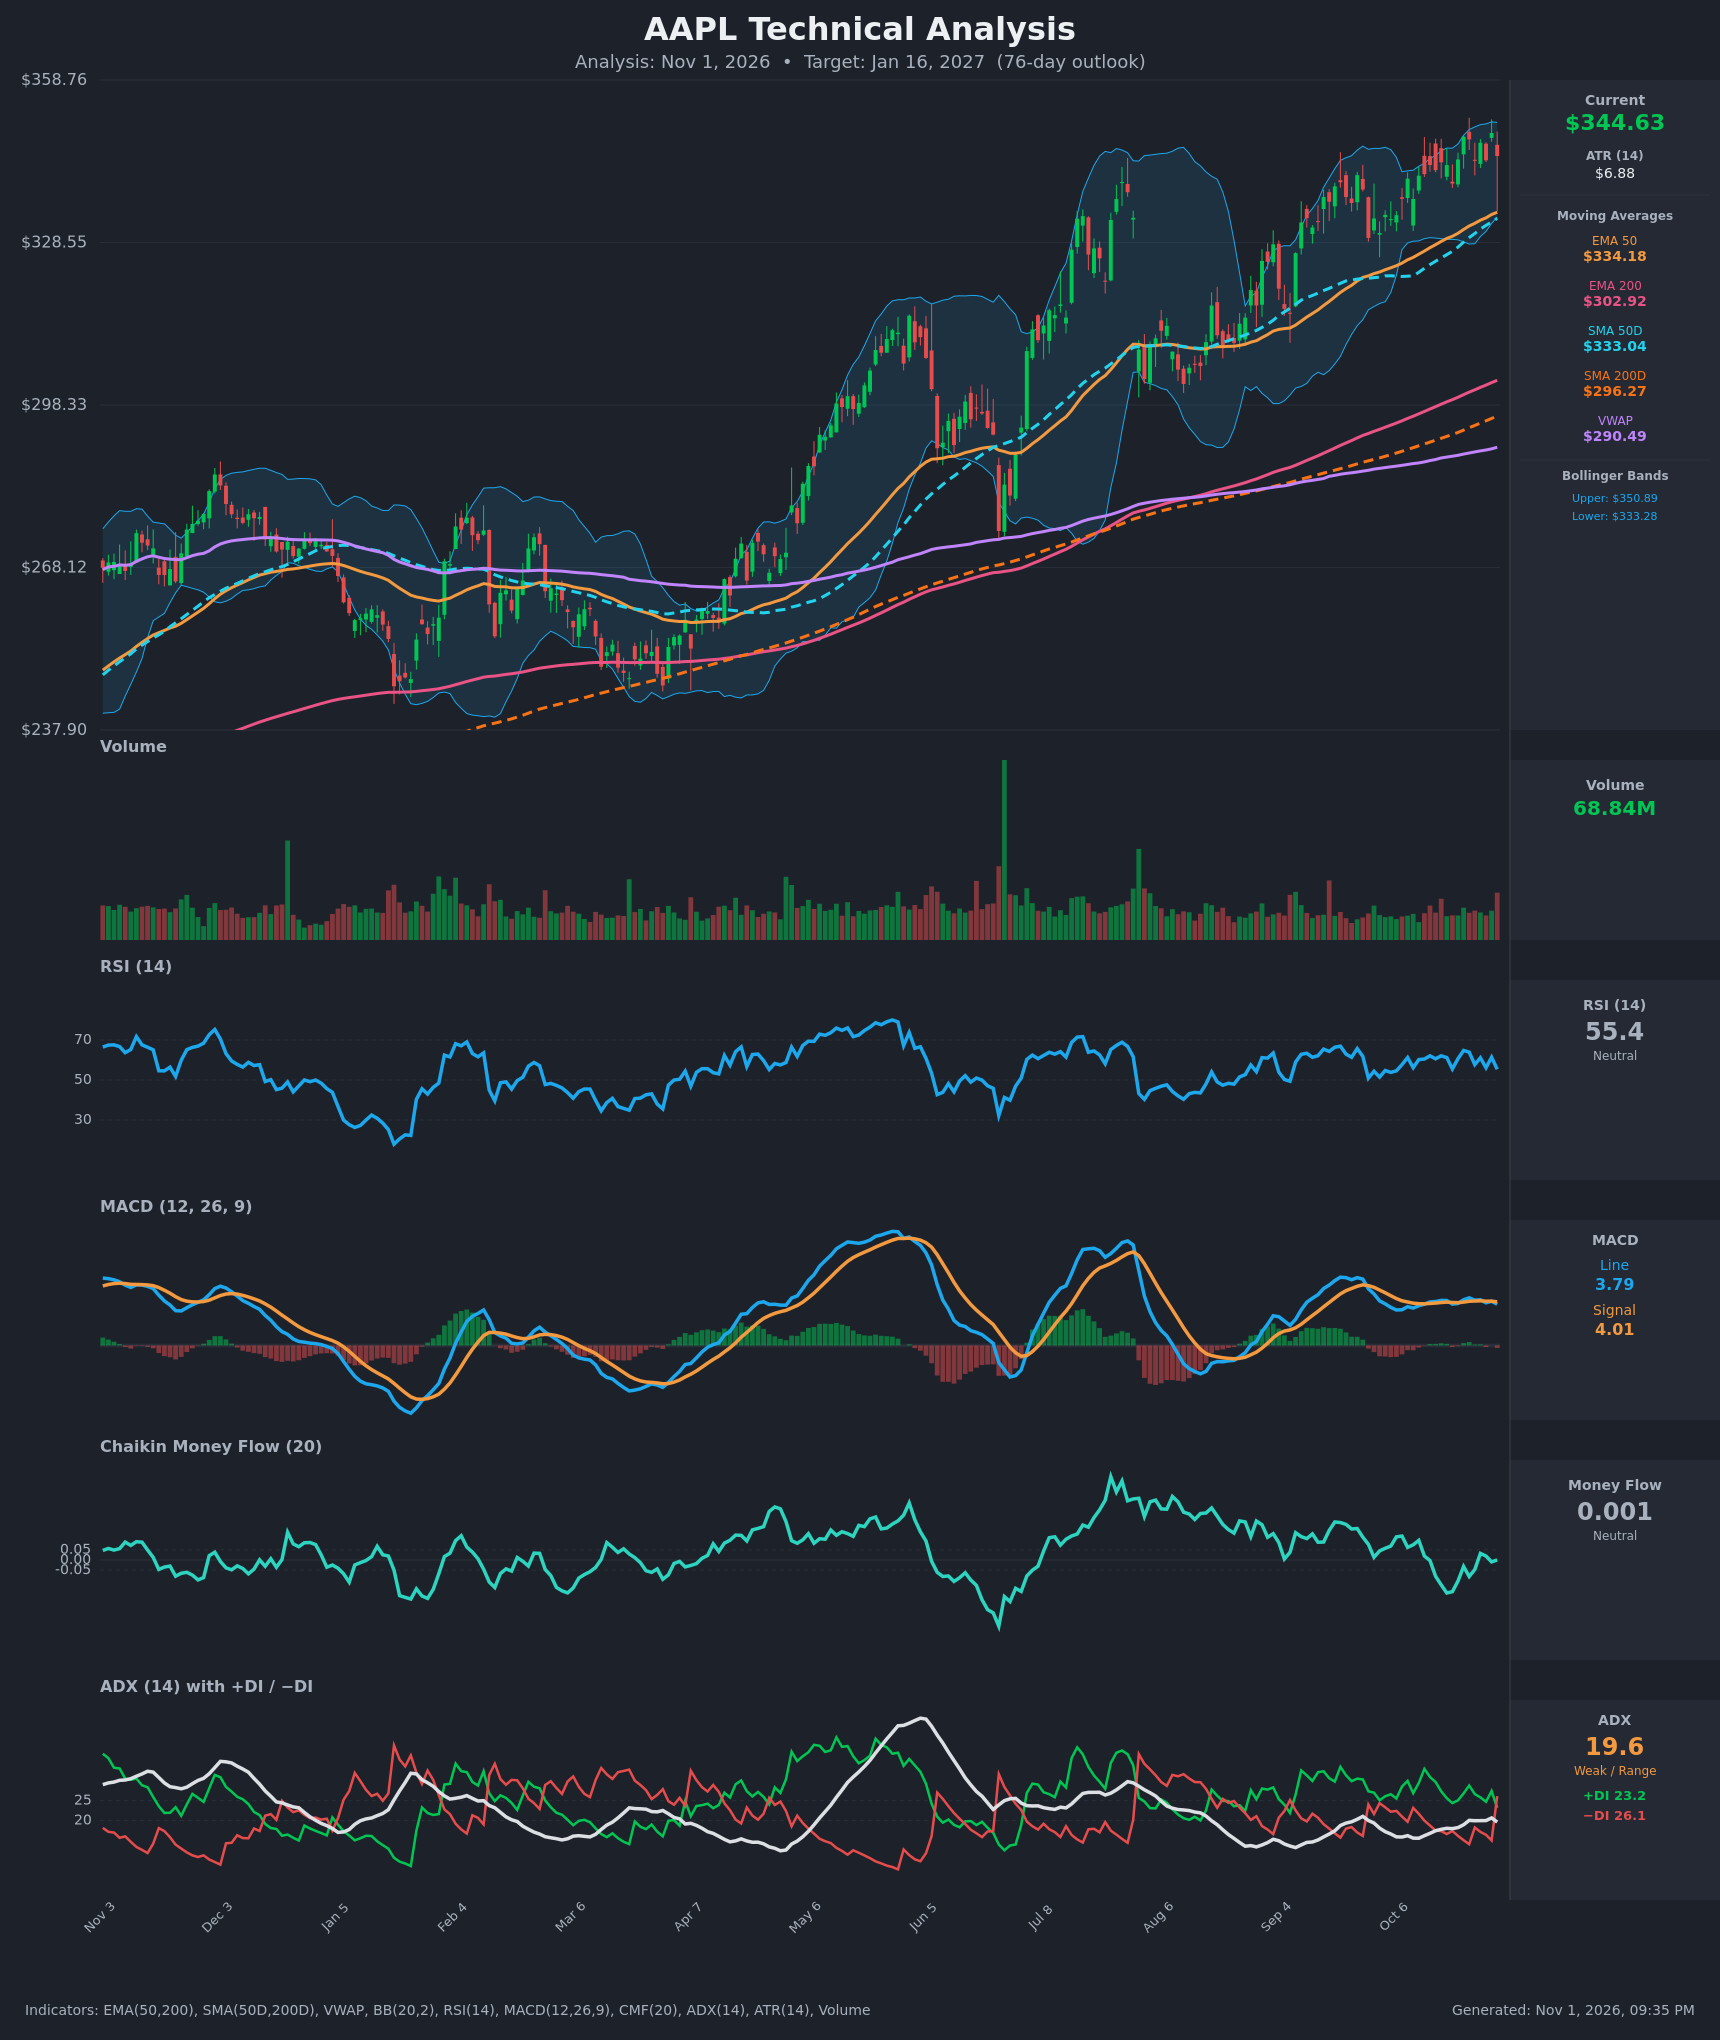
- RSI (14): 55.35, a neutral mid-range reading. It has faded from the low 60s (62.1 on Oct 16 and 64.8 on Oct 22) and stayed well clear of overbought. Momentum is flat to slightly softer, but there is room to rise. [Neutral]
- 20 EMA: The 20 EMA value was not supplied. The 50 EMA at $334.18 is the dynamic support and sits about 3% below price. Price is above the 50 EMA and the 200 EMA ($302.92), and both are rising. Price is also above the SMA50D ($333.04), the SMA200D ($296.27) and VWAP ($290.49). [Bullish]
- MACD: The line is 3.786 and the signal is 4.010, so the histogram is slightly negative (about -0.22). A bearish crossover has just occurred (4.062 vs 4.066 on Oct 29, then 3.786 vs 4.010). Both lines are positive and flat around 4, so the momentum loss is mild rather than a clear reversal. [Bearish]
- Bollinger Bands (20): The bands run from $333.28 to $350.89, with the midline near $342.1. Price at $344.63 sits in the upper half. It has repeatedly failed to ride the upper band, with highs at $347-349. The bands are moderately tight (about 5% wide), which suggests consolidation near the highs. [Neutral]
- CMF (20): 0.001 is neutral, between -0.05 and +0.05. It has oscillated around zero for weeks, with no sustained accumulation, and has not confirmed the price highs. [Neutral]
- ADX (14): 19.6, below 20, so the trend is weak or range-bound. −DI (26.1) has just crossed above +DI (23.2) after +DI led for most of October, a short-term bearish shift in control. ADX is not rising, so the DI cross lacks trend strength. [Weak Trend, slight bearish tilt]
- Volume: 68.84M on the latest bar, which looks above the recent average. It came on a red candle with a long upper wick that reversed from $348.91 to $344.63. This is mild distribution at resistance, but it is a single bar. Volume has otherwise been unremarkable in the grind higher. [Mildly Bearish / Cautious]
DIVERGENCES & TRENDS
- Long-term structure: This is firmly bullish. A golden cross is in place (SMA50D $333.04 above SMA200D $296.27, EMA50 above EMA200). All the moving averages slope upward and price has made a series of higher highs and higher lows since the spring.
- Mild bearish divergence: Price made a new high ($348.91 on Oct 29) while RSI (61.4) and MACD (4.06) stayed below their earlier peaks (RSI ~77 in May, MACD ~7). CMF is also well below its summer highs. Momentum is weaker than the price trend.
- Short-term shifts: The MACD bearish crossover and the −DI over +DI cross both point to near-term consolidation or a pullback. ADX below 20 means neither side has control, so this reads as digestion within an uptrend rather than a breakdown.
- Gap to the averages: Price is about 3% above the EMA50/SMA50D, which are converging just below the lower Bollinger Band ($333). That zone is the logical pullback target if the pause deepens.
- Weight of evidence: Trend structure is clearly bullish, while short-term momentum is mildly bearish and neutral in CMF and ADX. Over a 76-day horizon the trend structure carries more weight, but conviction is modest.
CHART PATTERNS
- Ascending Triangle (continuation, bullish): This is the closest match. Flat resistance sits at $348-349 and the lows keep rising (the EMA50/SMA50D trendline near $333-334 is climbing). A breakout above $349 on volume would project a measured move of roughly $16 (triangle height) to about $365.
- Bearish Double/Triple Top (risk case): Four failed pushes at $347-349 (Oct 22, 23, 27 and 29) mimic a top. Confirmation needs a close below the neckline at roughly $339.50 (the Oct 20 low), then a close below the $333-334 support cluster. The measured downside from that break would be roughly $315-318, near the Bollinger/MA convergence zone and the prior consolidation base.
- Neither pattern is confirmed yet. The ascending triangle is favored because it aligns with the dominant uptrend and rising moving averages.
POTENTIAL SCENARIOS
- Scenario 1: Bullish Breakout Continuation — Price holds above the EMA50/SMA50D zone, consolidates, and breaks the $348.91 resistance as the ascending triangle resolves. Trigger: daily close above $349 with volume above average and MACD re-crossing its signal. Target: $360-366 (the measured move is about $365). Invalidation: daily close below $333. (45% probability)
- Scenario 2: Bearish Pullback to Trend Support — The triple-top attempt and the MACD/DI shift lead to a correction toward the rising 50-day averages and below. Trigger: close below $339.50, then below $333. Target: $315-322, with the lower end near the gap to the SMA200D. Invalidation: reclaim of $349. (30% probability)
- Scenario 3: Neutral Range Consolidation — Weak ADX keeps AAPL range-bound between $333 and $349 as the 50-day averages catch up. Trigger: continued failure at $349 with support holding at $333-334. Target: $335-348. Invalidation: close outside the range on volume. (25% probability)
PRICE TARGETS
- Target Price: $356.00 (76 days; about +3.3% from the current price)
- Expected Range: $318.00 to $380.00 (width $62 = about 18% of the current price, matching the 61-180 day guidance)
- Key Levels: Support at $334.18 (EMA50, with the SMA50D and lower Bollinger Band just below), Resistance at $348.91 (recent swing high)
OVERALL BIAS
OVERALL BIAS: BULLISH - The long-term structure is strong: a golden cross, price above all the rising moving averages, and an ascending-triangle setup under $349. Near-term momentum is soft (MACD below signal, −DI above +DI, ADX under 20, neutral CMF), so expect consolidation or a pullback toward $334 before an upside resolution. Conviction is modest.
This is educational analysis and not financial advice.