SOFI 62-day bullish forecast — Nov 1, 2026
- Bias: Bullish
- Timeframe: 62 days (made Nov 1, 2026, target date Jan 1, 2027)
- Price at analysis: $16.76
- Price target: $17.80
- Expected range: $14.80 – $19.30
- Result: Pending — graded after the close on Jan 1, 2027
Get a free AI analysis of SOFI today
Analysis
TECHNICAL INDICATORS
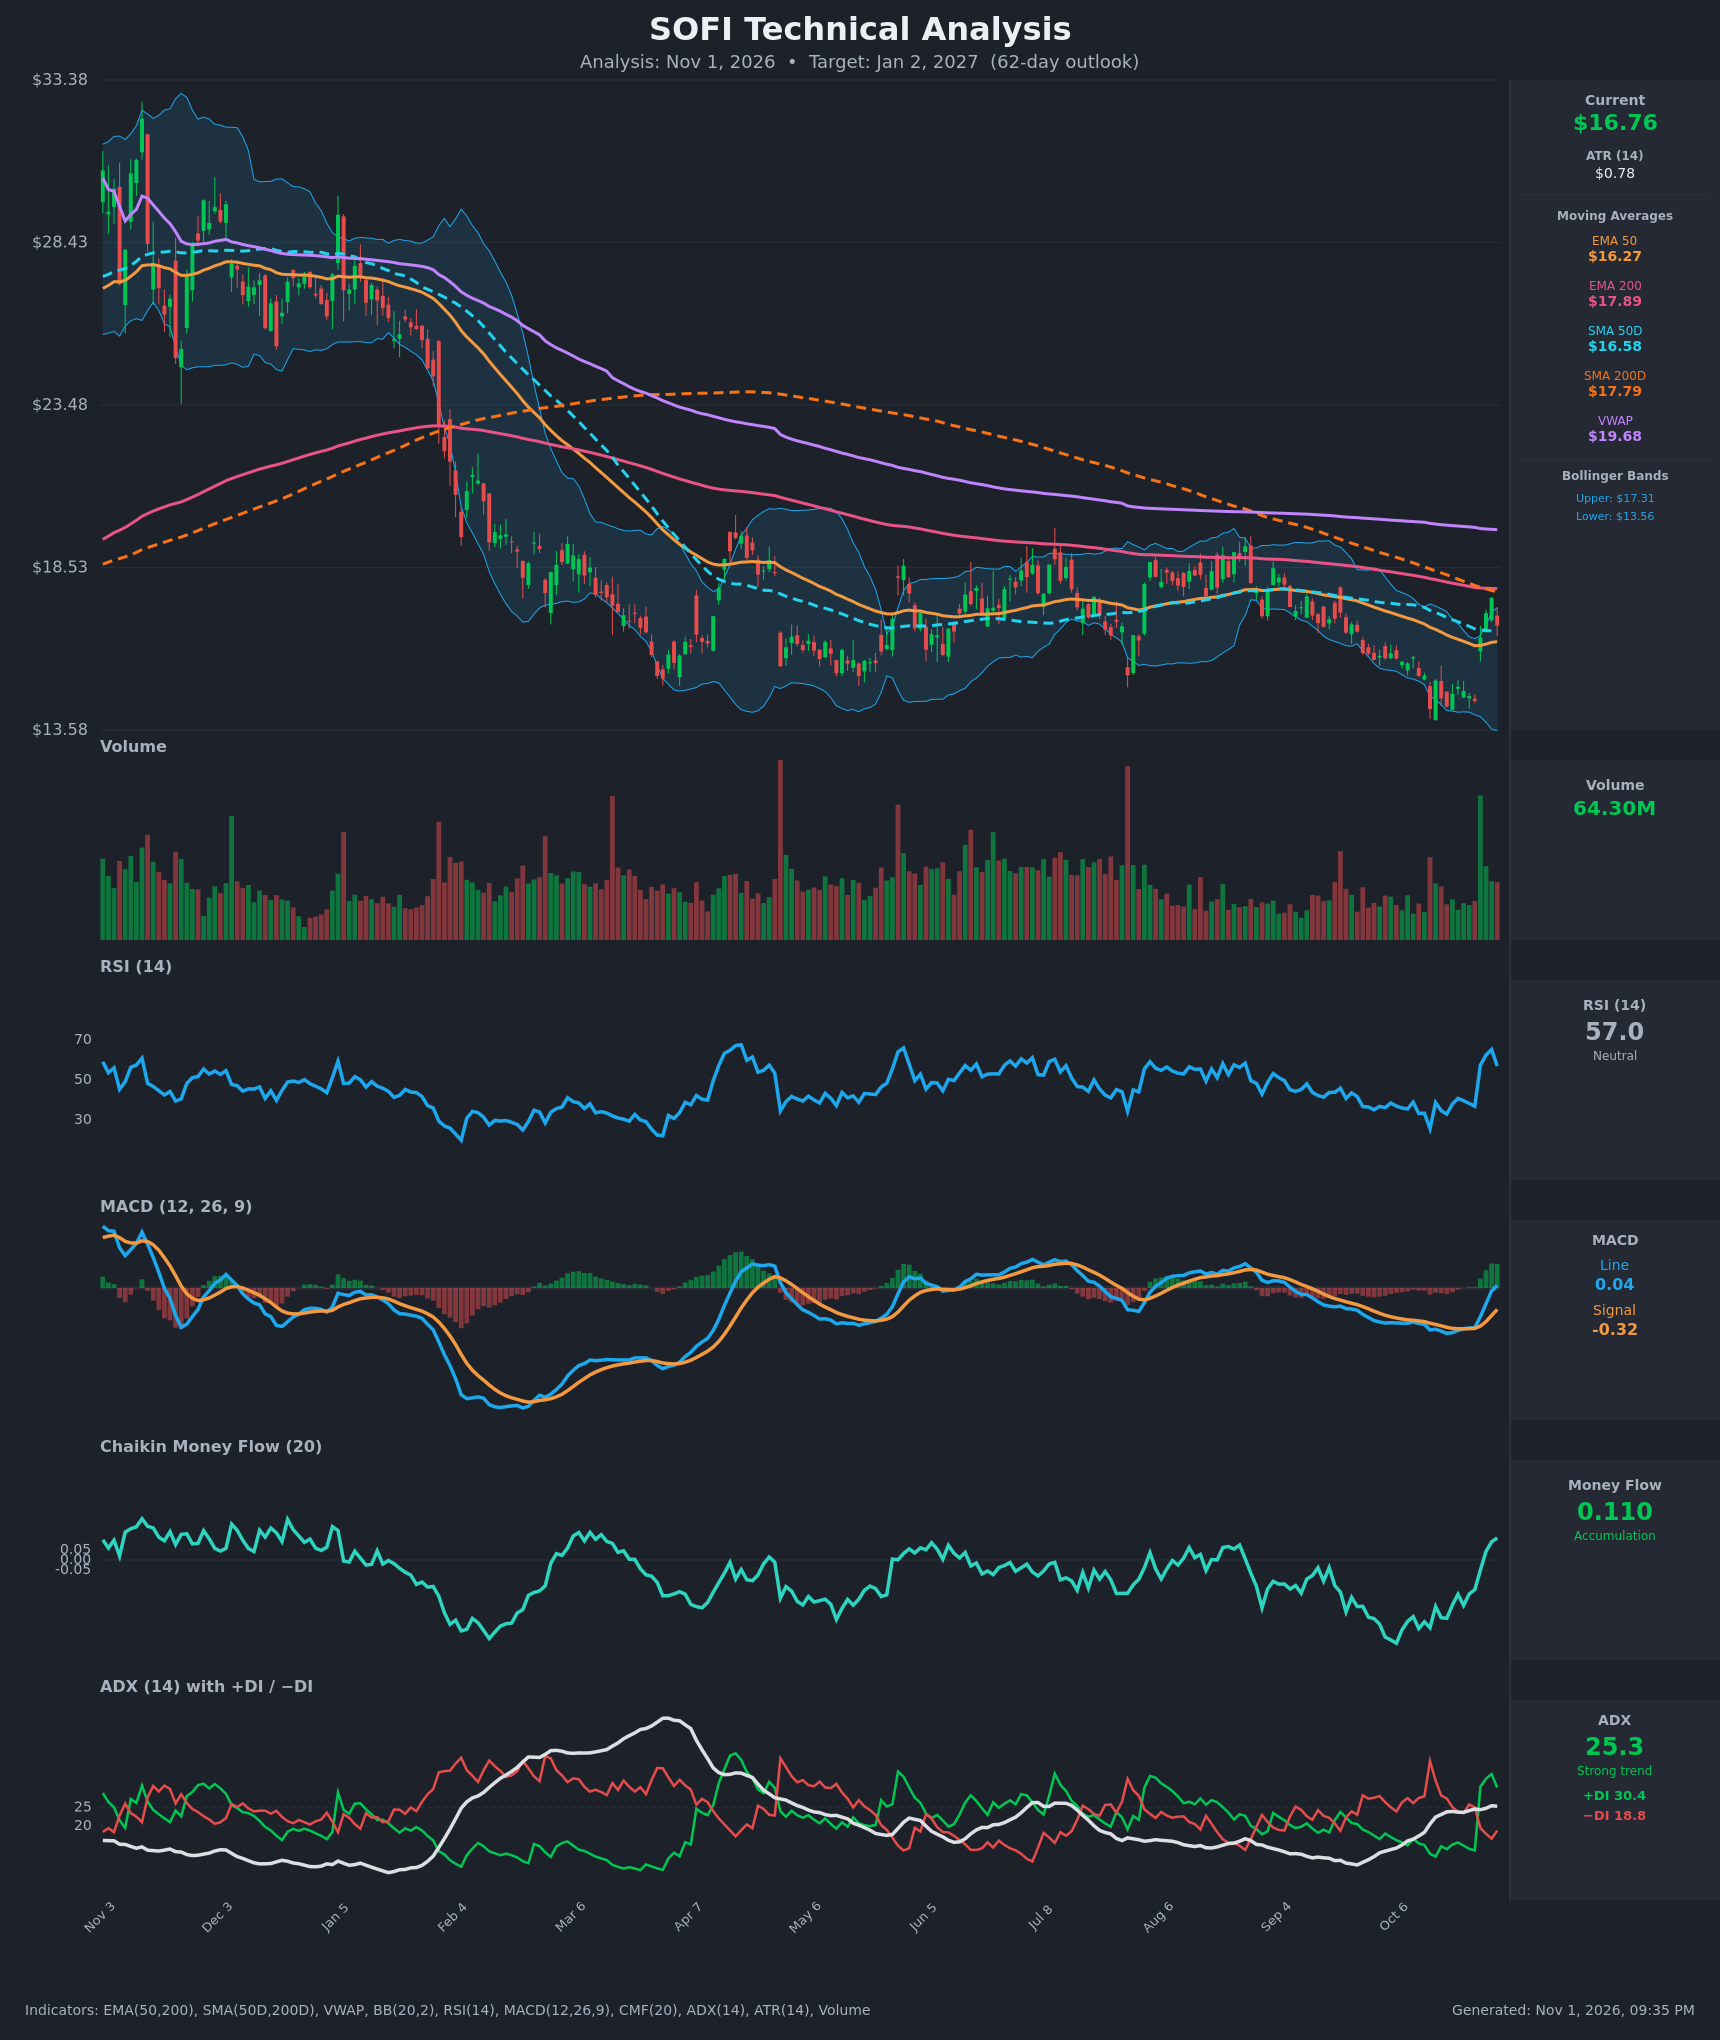
- RSI (14): 56.97, down from a 65.2 peak on Oct 29. It jumped from the low 30s (25.7 on Oct 14) back above the 50 midline. It is neutral-to-positive, with a slight cooling after the first rejection. [Bullish]
- 20 EMA: No 20 EMA value was supplied. The nearest reference is the EMA 50 at $16.27, and price at $16.76 is above it. It was reclaimed on Oct 27 after months of resistance and now acts as first support. [Bullish]
- MACD: Line 0.038 is above signal -0.322, a fresh bullish crossover on Oct 30 with the line moving above zero. The histogram is positive and expanding, from -0.03 to +0.36 in four sessions. The signal line is still deeply negative, so the move is early. [Bullish]
- Bollinger Bands (20): Upper $17.31, lower $13.56, midline about $15.44. Price at $16.76 is in the upper third of the band after bouncing from a lower-band hug at $14.2-14.5. The bands are wide, so volatility is elevated, and the upper band at about $17.3 is near-term resistance. [Bullish]
- CMF (20): 0.110, up from -0.34 on Oct 12 and above +0.05. It has turned positive for the first time in months, which points to real accumulation on the bounce. [Accumulation]
- ADX (14): 25.3 with +DI 30.4 above −DI 18.8. The +DI/−DI crossover happened on Oct 27, and ADX is just crossing the 25 threshold. This is a trend that has just flipped to the upside, not yet a mature one. [Strong Trend + Bullish direction]
- Volume: 64.30M, with the Oct 27 breakout bar the highest of the past several months on the chart. The jump from $14.46 to $16.40 came on very heavy volume, which looks like a catalyst-driven reversal. Volume has stayed elevated, and the Oct 30 pullback to $16.76 occurred on lower volume than the breakout. [Bullish – accumulation on the rally, orderly pullback]
DIVERGENCES & TRENDS
- Bullish divergence (RSI/MACD): Price made a new low near $14.2 on Oct 14, while RSI and MACD momentum had been bottoming in the middle of the year's range. CMF turned from -0.34 to +0.11 as price rose. This is a confirmed momentum and flow turn, not a divergence still waiting to resolve.
- MACD bullish crossover: On Oct 30 the line crossed above the signal and zero, with the histogram expanding.
- DI crossover: +DI overtook −DI on Oct 27 (30.6 vs 19.5) and the gap has widened to 11.6 points.
- Long-term bearish structure is intact: Price remains below EMA 200 ($17.89), SMA 200 ($17.79) and VWAP ($19.68). EMA 50 is below EMA 200 and SMA 50 ($16.58) is below SMA 200 ($17.79), so the death cross from earlier in the year remains in force. The 50/200 gaps are narrowing only marginally.
- Chart structure: The year-long decline runs from about $33 to $14. Price has made lower highs since the August peak near $19, and the Oct 29 high of $17.61 was rejected right under the 200-day cluster.
- Short-term: A -4.8% pullback on Oct 30 from $17.61 is a first test of the breakout, with price holding above the 50-day averages.
CHART PATTERNS
- Bullish Falling Wedge / Expanding Triangle (reversal): The August-October decline from about $19 to $14.2 resembles a falling wedge or downward channel. The Oct 27 gap-up on heavy volume is a breakout from the upper trendline, and the pattern target is a retracement toward the start of the wedge, around $18.5-19.
- Bullish Double Bottom (loose): Lows near $14.2-14.5 on Oct 14 and Oct 26 are separated by a bounce to about $15.2. The neckline is around $15.2, which the Oct 27 move cleared. The measured target is about $16.1-16.3, already achieved, so the next resistance is the 200-day cluster.
- Resistance cluster: EMA 200 ($17.89) and SMA 200 ($17.79), plus the upper Bollinger band ($17.31), form a stacked ceiling from $17.3 to $17.9. This is the key hurdle for any continuation, and the pattern targets above it need a close above $17.9.
- Larger context: A Bearish Descending Triangle or downtrend continuation remains possible if the breakout fails and price returns to $14.2.
POTENTIAL SCENARIOS
- Scenario 1: Bullish Breakout Through the 200-Day Cluster — Momentum, flows and trend direction all turned together. Price consolidates above the 50-day averages, then clears the stacked $17.3-17.9 resistance, and the falling-wedge target comes into play. Trigger: daily close above $17.90 on rising volume. Target: $18.50-19.30 (prior August highs and the top of the 62-day range). Invalidation: daily close below $15.90, which breaks the EMA 50 / SMA 50 support and the pullback low. (50% probability)
- Scenario 2: Neutral Range Between the 50s and 200s — The stock is capped by the 200-day averages and supported by the 50-day averages, stalling in a $16.0-17.9 band as the post-catalyst momentum fades. Trigger: repeated failures near $17.5-17.9 with support holding at $16.3. Target: $16.20-17.60. Invalidation: close above $17.90 or below $15.90. (20% probability)
- Scenario 3: Bearish Failed Breakout — The Oct 27 rally is a dead-cat bounce within the long-term downtrend. Rejection at the 200-day cluster and the VWAP leads to a retest of the lows. Trigger: close below $16.27 followed by $15.40 (the Bollinger midline). Target: $14.40-14.80. Invalidation: close above $17.90 with expanding volume. (30% probability)
PRICE TARGETS
Timeframe: 62 days (Jan 2, 2027). The range is scaled for the 61-180 day band.
- Target Price: $17.80 (+6.2%), just under the 200-day cluster. The bias is modestly bullish, but the overhead resistance limits the base-case move.
- Expected Range: $14.80 to $19.30. The width is $4.50, or 26.8% of the current price, which fits the 18-30% guideline.
- Key Levels: Support at $16.27 (EMA 50, with SMA 50 at $16.58 just above it). Resistance at $17.89 (EMA 200, with SMA 200 at $17.79 just below it).
OVERALL BIAS
OVERALL BIAS: BULLISH - Momentum, money flow and trend direction have all turned up together: a MACD bullish crossover, CMF at +0.11, +DI well above −DI with ADX at 25, and a volume-backed gap-up out of a falling-wedge-style decline. Conviction is modest because price is still below the 200-day averages and VWAP, which form a dense $17.3-17.9 resistance zone, so only a modest gain to about $17.80 is the base case.
This is educational analysis and not financial advice.