AMD 76-day bearish forecast — Nov 1, 2026
- Bias: Bearish
- Timeframe: 76 days (made Nov 1, 2026, target date Jan 15, 2027)
- Price at analysis: $504.80
- Price target: $478.00
- Expected range: $425.00 – $545.00
- Result: Pending — graded after the close on Jan 15, 2027
Get a free AI analysis of AMD today
Analysis
TECHNICAL INDICATORS
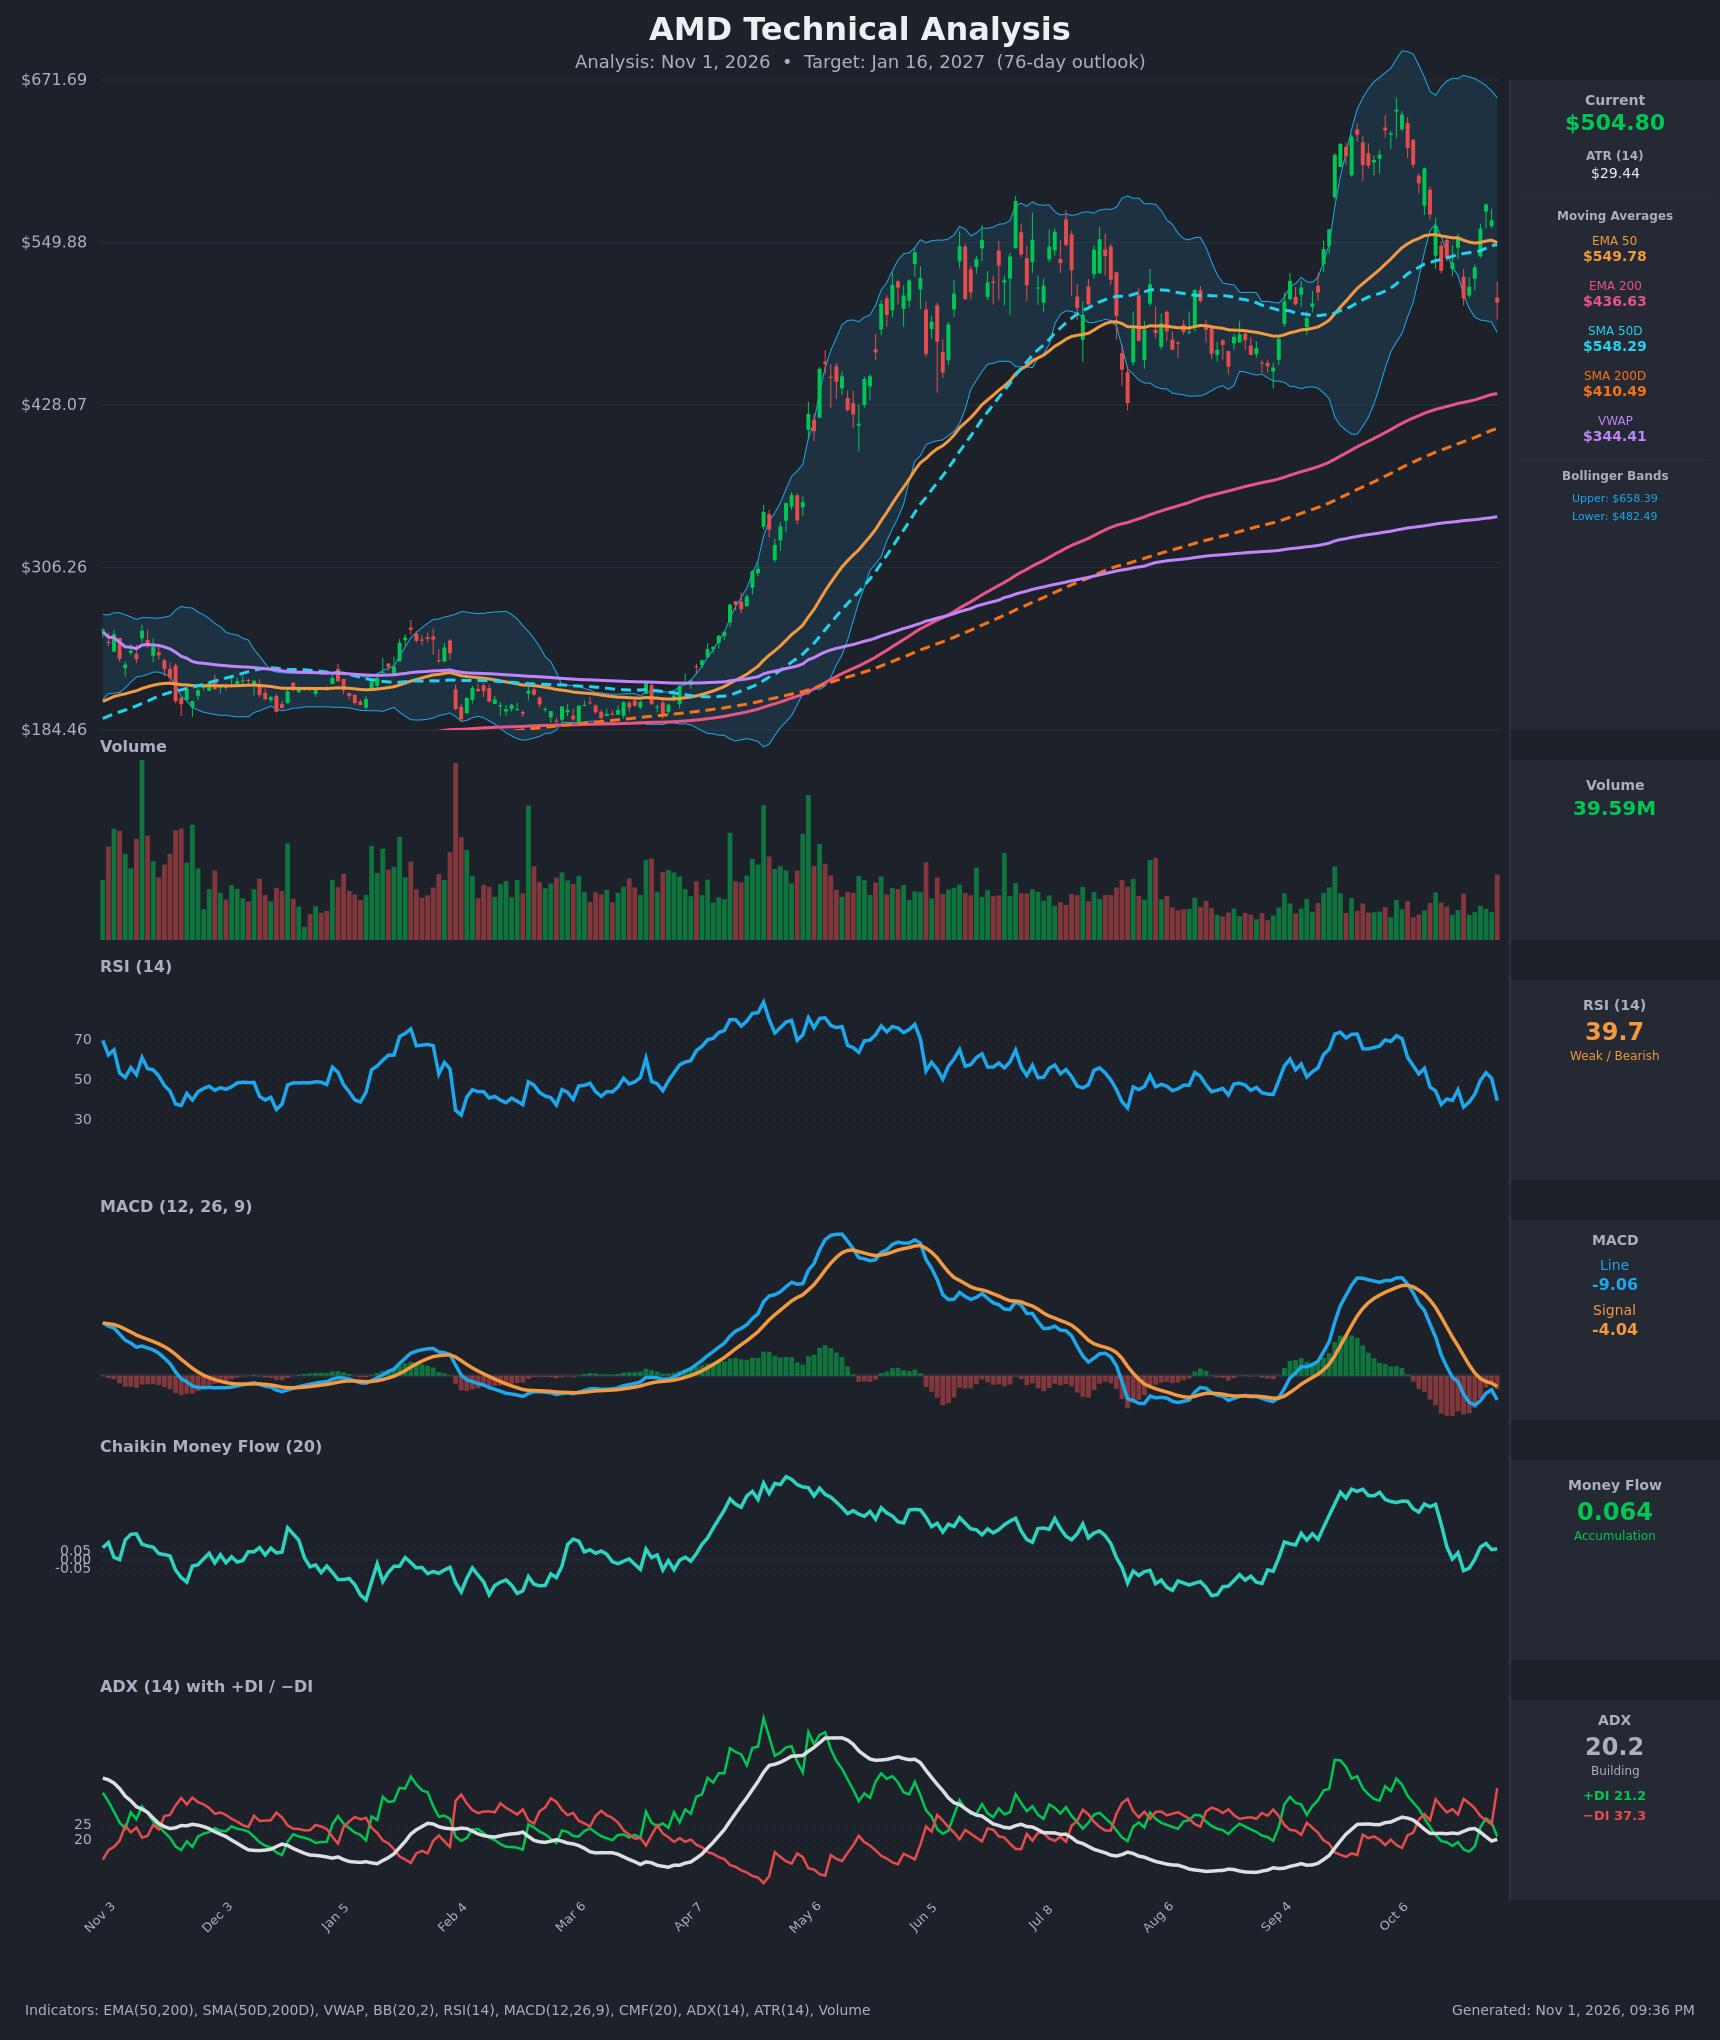
- RSI (14): 39.67, down from 50.9 a day earlier. It sits in the weak half of the range but is not yet oversold. Since the Oct 13 peak it has made lower highs (55.8, then 53.6) and lows near 36-38. [Bearish]
- 20 EMA: The 20 EMA value was not supplied, so this uses the EMA 50 at $549.78 and SMA 50D at $548.29. Price at $504.80 is about 8% below both, and the Oct 30 close broke back under them after a failed rebound. The averages are flattening and now act as resistance. [Bearish]
- MACD: Line -9.06 is below signal -4.04, with a histogram of about -5. The line crossed below the signal on Oct 15-20 and fell below zero on Oct 20. After a brief bounce to -5.24, the gap widened again. [Bearish]
- Bollinger Bands (20): Price at $504.80 is in the lower third of the bands (lower $482.49, upper $658.40). The bands are very wide, about 35% of price, after the October spike, so volatility is elevated. A move back toward the lower band is likely, and a close below it would signal acceleration. The midline, near $570, is overhead resistance. [Bearish]
- CMF (20): 0.064, only marginally above the +0.05 accumulation threshold and well down from 0.32 on Oct 13. Buying pressure has faded almost to neutral, but it has not turned into distribution. [Neutral]
- ADX (14): 20.2 with −DI 37.3 above +DI 21.2. The trend is weak, but sellers dominate: −DI jumped from 25 to 37 in one session. A rising ADX would confirm a developing downtrend. [Weak Trend, bearish direction]
- Volume: 39.59M. The latest red bar is the largest since mid-October and comes on a -10.9% day, so the drop came with expanded participation. Overall volume has been below the April-June levels. [Bearish, distribution-style decline]
DIVERGENCES & TRENDS
- Price made a higher high near $655-660 in early October versus ~$560 in June, but RSI and MACD peaked at much lower levels in October than in May. This is a mild bearish momentum divergence on the longer view.
- The Oct 28-29 rebound failed at the EMA 50 and SMA 50D (~$550), and price rolled over into a lower high. MACD has already crossed bearishly, and the −DI/+DI gap is the widest in the recent table.
- CMF has fallen from 0.32 to 0.06, so accumulation is fading.
- The long-term structure is still up: price is above the EMA 200 ($436.63) and SMA 200D ($410.49), and EMA 50 is above EMA 200 and SMA 50D above SMA 200D. There is no death cross, and the golden cross remains in place.
- Price is far above VWAP ($344.41), which shows the advance was extended and leaves room for mean reversion.
CHART PATTERNS
- Since the September gap-up, price has formed a lower high at ~$605 on Oct 13 and a lower high at ~$578 on Oct 28, then broke back below the 50-period averages. This resembles a Bearish Rising Wedge / double-top-type reversal (compare the Bearish Double Top in the reference diagram) after the vertical run to ~$655.
- The measured downside is a retracement of the September breakout leg toward the $430-$480 gap and consolidation zone, with the EMA 200 near $437 as the deeper magnet.
- The July-September base between roughly $430 and $500 is the main support zone. A break below $482 would confirm the reversal pattern.
- The pattern is not clean, and ADX at 20 shows trend strength is weak. A reclaim of $550 would invalidate the bearish reading.
POTENTIAL SCENARIOS
- Scenario 1: Bearish Retracement to the Gap/Base — Price loses the lower Bollinger Band and the September breakout area, then drifts toward the prior consolidation and the rising EMA 200. Trigger: daily close below $482.49 with −DI staying above 30 and ADX rising above 25. Target: $440-$480, with an extreme test of the EMA 200 near $437. Invalidation: daily close above $550 (EMA 50/SMA 50D). (50% probability)
- Scenario 2: Bullish Rebound and Recovery — Price holds the lower band area, RSI turns up from the high-30s, MACD curls up, and buyers reclaim the 50-period averages. Trigger: close above $550 with a MACD bullish crossover. Target: $580-$620, with a retest of the $650-$660 high possible. Invalidation: close below $482. (30% probability)
- Scenario 3: Neutral Range Consolidation — Price chops between ~$470 and ~$550 as ADX stays near or below 20 and volume dries up. Trigger: repeated holds above $482 and rejections at $550. Target: $490-$530. Invalidation: close outside $470-$555. (20% probability)
PRICE TARGETS
- Target Price: $478.00 (76-day, Jan 16, 2027)
- Expected Range: $425.00 to $545.00 (width $120, ≈23.8% of current price, consistent with the 61-180 day guidance of 18-30%)
- Key Levels: Support at $482.49 (lower Bollinger Band; below that, $437 EMA 200), Resistance at $549.78 (EMA 50 / SMA 50D)
OVERALL BIAS
OVERALL BIAS: BEARISH - Price broke back below the EMA 50 and SMA 50D after a failed rebound. MACD is negative and below its signal, −DI (37.3) dominates +DI (21.2), and the latest drop came on heavier volume with CMF fading to neutral. The long-term uptrend above the 200-day averages limits the downside, so the target is a pullback toward the $440-$480 zone rather than a collapse. Conviction is modest.
This is educational analysis and not financial advice.