AMZN 76-day bearish forecast — Nov 1, 2026
- Bias: Bearish
- Timeframe: 76 days (made Nov 1, 2026, target date Jan 15, 2027)
- Price at analysis: $240.35
- Price target: $233.00
- Expected range: $211.00 – $262.00
- Result: Pending — graded after the close on Jan 15, 2027
Get a free AI analysis of AMZN today
Analysis
TECHNICAL INDICATORS
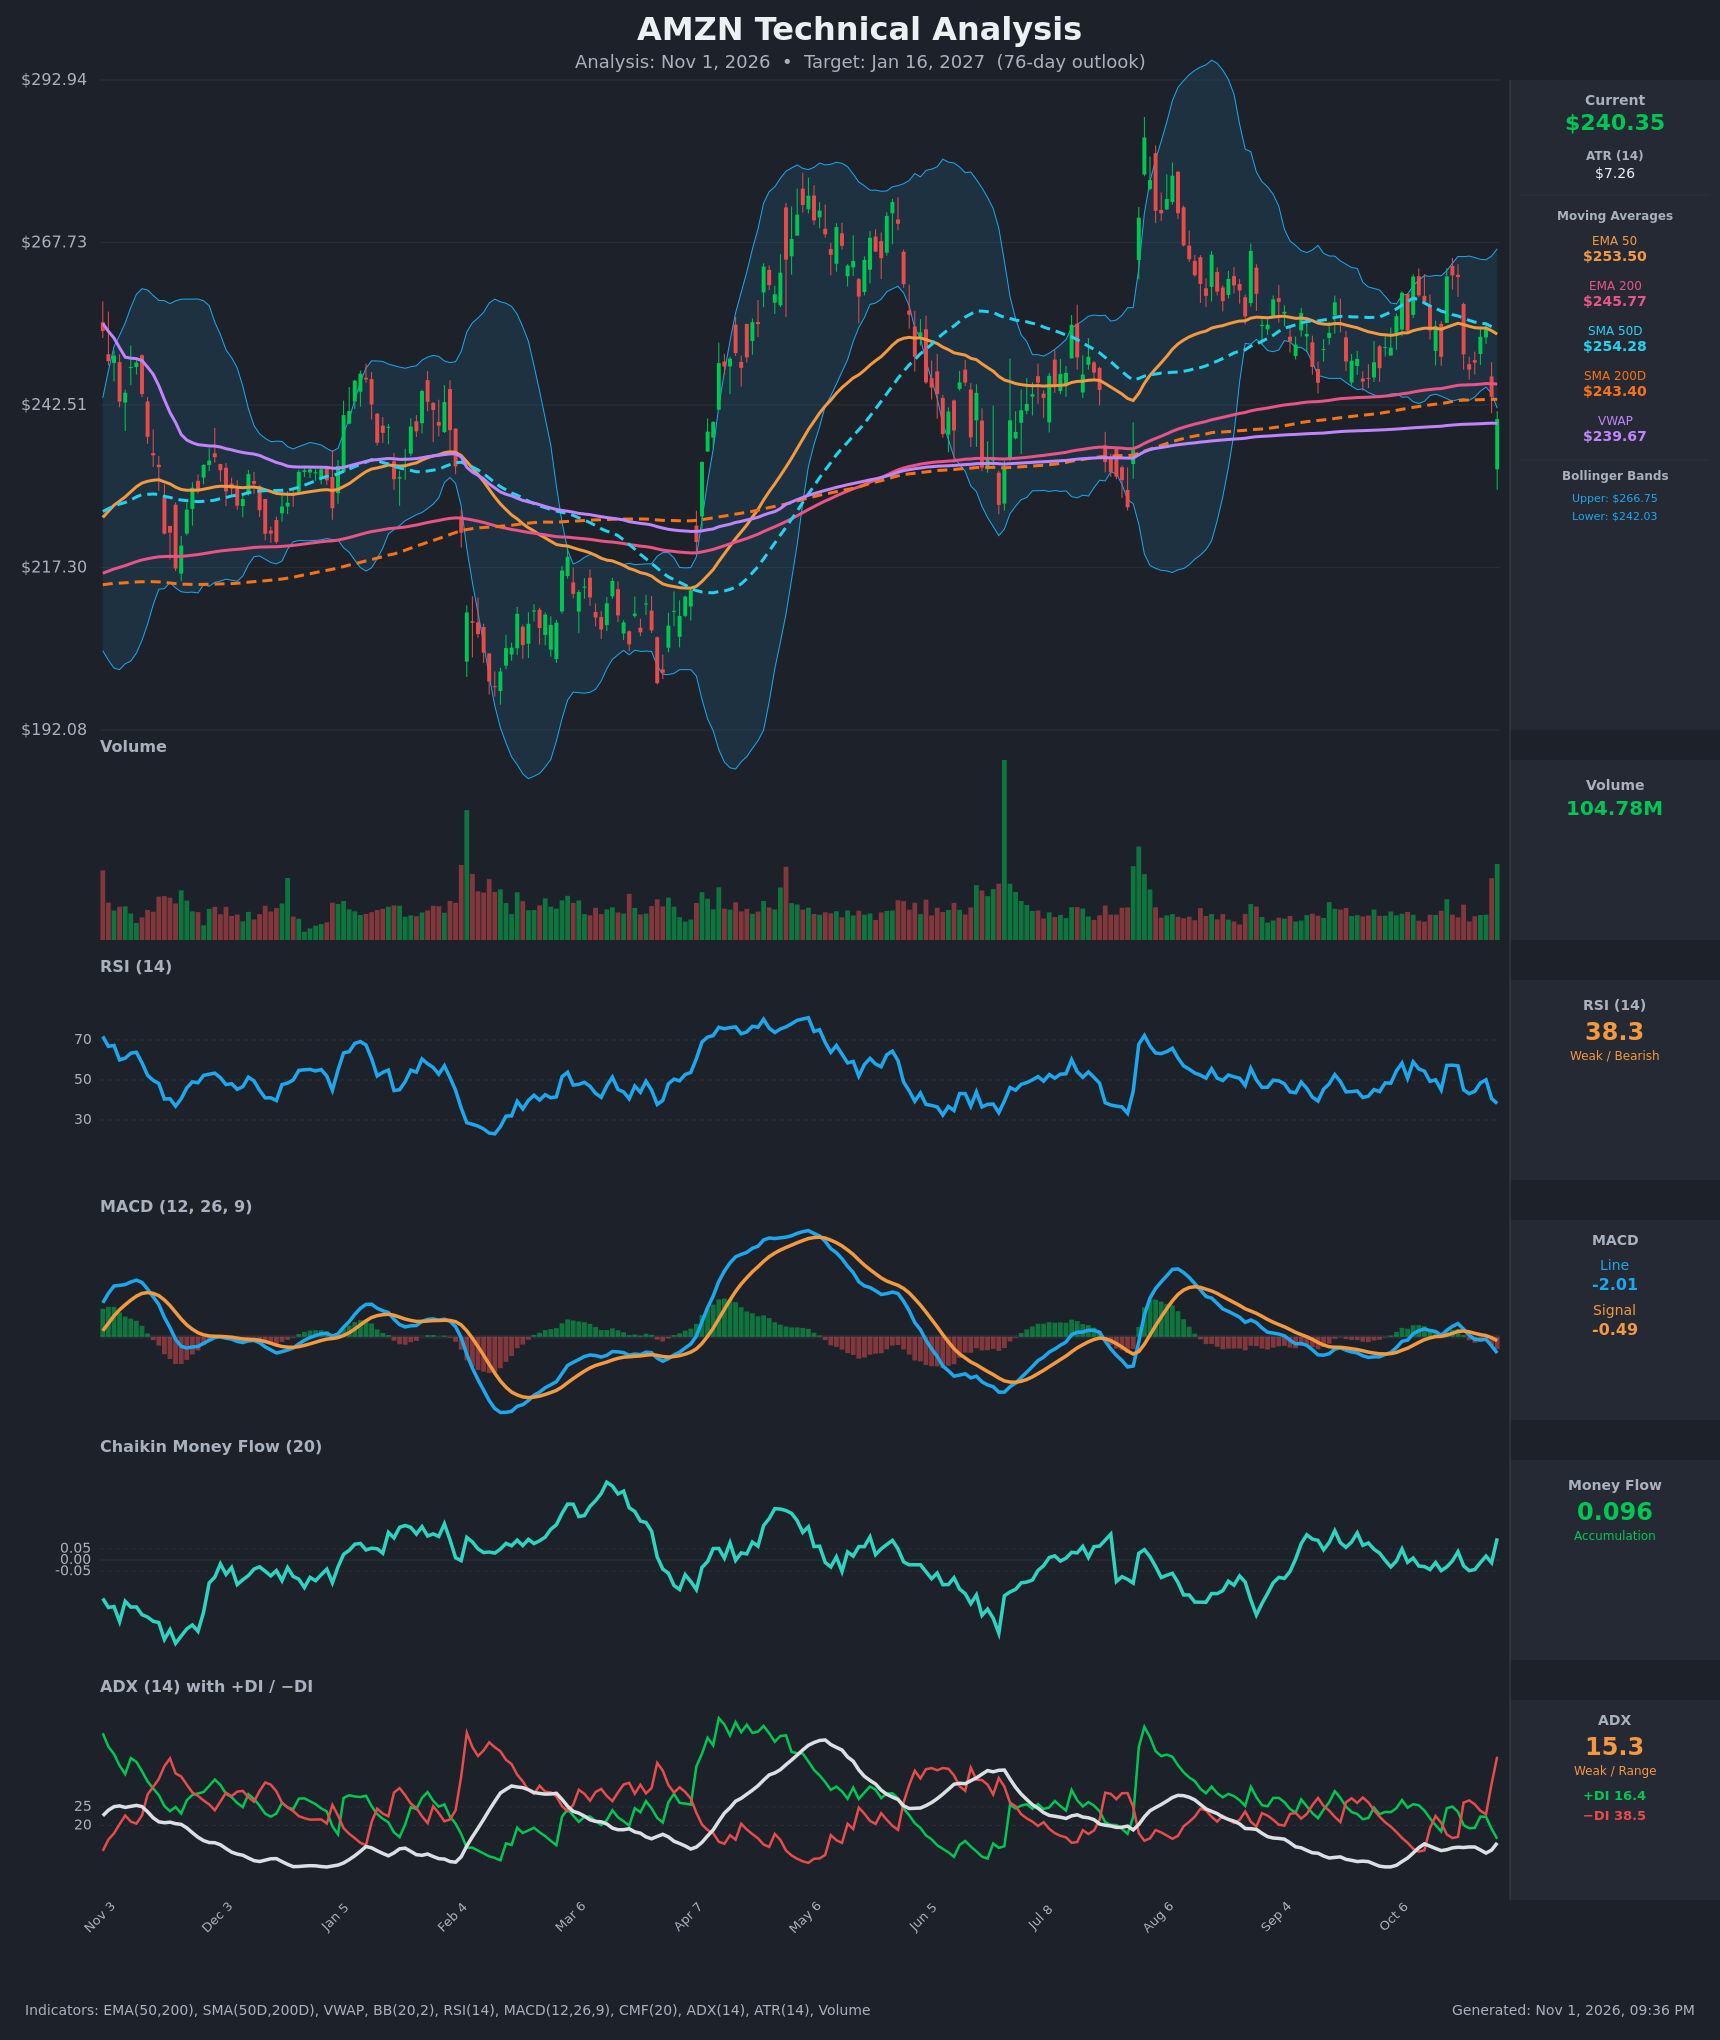
- RSI (14): 38.26, down from about 57 on Oct 21 and 50 on Oct 28. It is weak but not oversold (<30). Momentum is pointing down, with room to fall further. [Bearish]
- 20 EMA: Not supplied, so the nearest proxy is the 50-day trend. Price at $240.35 is below EMA50 ($253.50) and well below the short-term average that tracked the $250-262 range. Price has lost its short-term support, and those averages are now overhead resistance. [Bearish]
- MACD: The line is -2.01 against a signal of -0.49. The bearish crossover happened around Oct 26-29, and the histogram is now clearly negative and widening. Momentum is accelerating to the downside. [Bearish]
- Bollinger Bands (20): Upper $266.75, lower $242.03. Price closed below the lower band after a gap-down candle. That is a sign of strong selling pressure, though it also raises the odds of a short-term mean-reversion bounce. Band width is moderate. [Bearish]
- CMF (20): 0.096, above the +0.05 threshold and the only constructive reading. The reading is recent and was lifted by the heavy-volume final bar, so it does not yet confirm sustained accumulation. It also conflicts with price action. [Accumulation]
- ADX (14): 15.3, below 20 and weak. −DI (38.5) is far above +DI (16.4), and −DI has surged from 17.6 on Oct 19. The trend is weak in strength but a clear bearish directional shift is underway; a rise in ADX would confirm it. [Weak Trend, Bearish direction]
- Volume: 104.78M, the largest bar on the chart in months, on a red gap-down candle. This looks like an event-driven (likely earnings) repricing, and heavy-volume breakdowns tend to have follow-through. The heavy volume also could mean partial capitulation. [Bearish, high-volume breakdown]
DIVERGENCES & TRENDS
- Price is below EMA50 ($253.50), SMA50D ($254.28), EMA200 ($245.77) and SMA200D ($243.40). Price is just above VWAP ($239.67), which is the last support in the cluster.
- There is no death cross. SMA50D ($254.28) is still above SMA200D ($243.40), and EMA50 is above EMA200. However, the gap between the 50s and 200s is narrowing, and the 50-day averages are rolling over. This points to a possible bearish crossover over the next 1-3 months if weakness continues.
- The MACD bearish crossover and the DI flip (−DI above +DI since Oct 22) are fresh and aligned.
- The one divergence is CMF turning up (0.096) while price falls. The reading could reflect intraday buying near the lows, but one bar is not a trend.
- Price spent Sep-Oct in a $245-$265 range. The Oct 19-21 high of about $262.5 was a lower high versus the Aug spike above $280. The range floor ($248-250) has now broken.
CHART PATTERNS
- Bearish Double Top (approximate): Two highs near $258-$263 (Oct 13 and Oct 19-21) with a neckline near $248-250 (Oct 16 and Oct 23 lows). Price has now closed through the neckline. The measured move is about $262 − $249 = $13-14, giving a target near $234-236.
- Range breakdown: The broader Sep-Oct consolidation below the Aug high is breaking to the downside. The next structural support is the Aug swing low near $225.
- Caveat: The ADX at 15 argues against a clean trending move. A bounce toward the neckline (about $248-250) to retest the break is plausible before the next leg lower.
POTENTIAL SCENARIOS
- Scenario 1: Bearish Double-Top Breakdown Continuation — The neckline break on heavy volume follows through, with a possible retest of $245-250 that fails. Trigger: daily close below the VWAP/$239 area. Target: $232-$234 first, then $225 and potentially $215. Invalidation: daily close back above $254 (the 50-day averages). (50% probability)
- Scenario 2: Bullish Oversold Rebound Back Into the Range — Price below the lower Bollinger Band, a positive CMF and the nearby 200-day averages attract dip buyers, and the gap fills. Trigger: reclaim of $246 (EMA200) on volume. Target: $254-$262. Invalidation: failure at $246 or a close below $235. (30% probability)
- Scenario 3: Neutral Range Consolidation — Price chops between the $225 support and the $250 neckline as the weak ADX suggests. Trigger: repeated holds above $230. Target: $235-$248. Invalidation: close outside $225-$254. (20% probability)
PRICE TARGETS
- Target Price: $233.00 (76-day, near the double-top measured move of about $234)
- Expected Range: $211.00 to $262.00 (width $51, about 21% of the current price, consistent with 61-180 day guidance)
- Key Levels: Support at $225.00, Resistance at $245.77 (EMA200, with SMA200D at $243.40 just below it and the 50-day averages at about $254)
OVERALL BIAS
OVERALL BIAS: BEARISH - Price broke below all four major moving averages and a double-top neckline on the heaviest volume in months. The MACD is in a bearish crossover and −DI dominates +DI by more than 2x. The positive CMF and the break below the lower Bollinger Band make a relief bounce likely, but they do not outweigh the breakdown.
This is educational analysis and not financial advice.