CRWV 76-day bearish forecast — Nov 1, 2026
- Bias: Bearish
- Timeframe: 76 days (made Nov 1, 2026, target date Jan 15, 2027)
- Price at analysis: $54.87
- Price target: $50.50
- Expected range: $42.50 – $60.00
- Result: Pending — graded after the close on Jan 15, 2027
Get a free AI analysis of CRWV today
Analysis
TECHNICAL INDICATORS
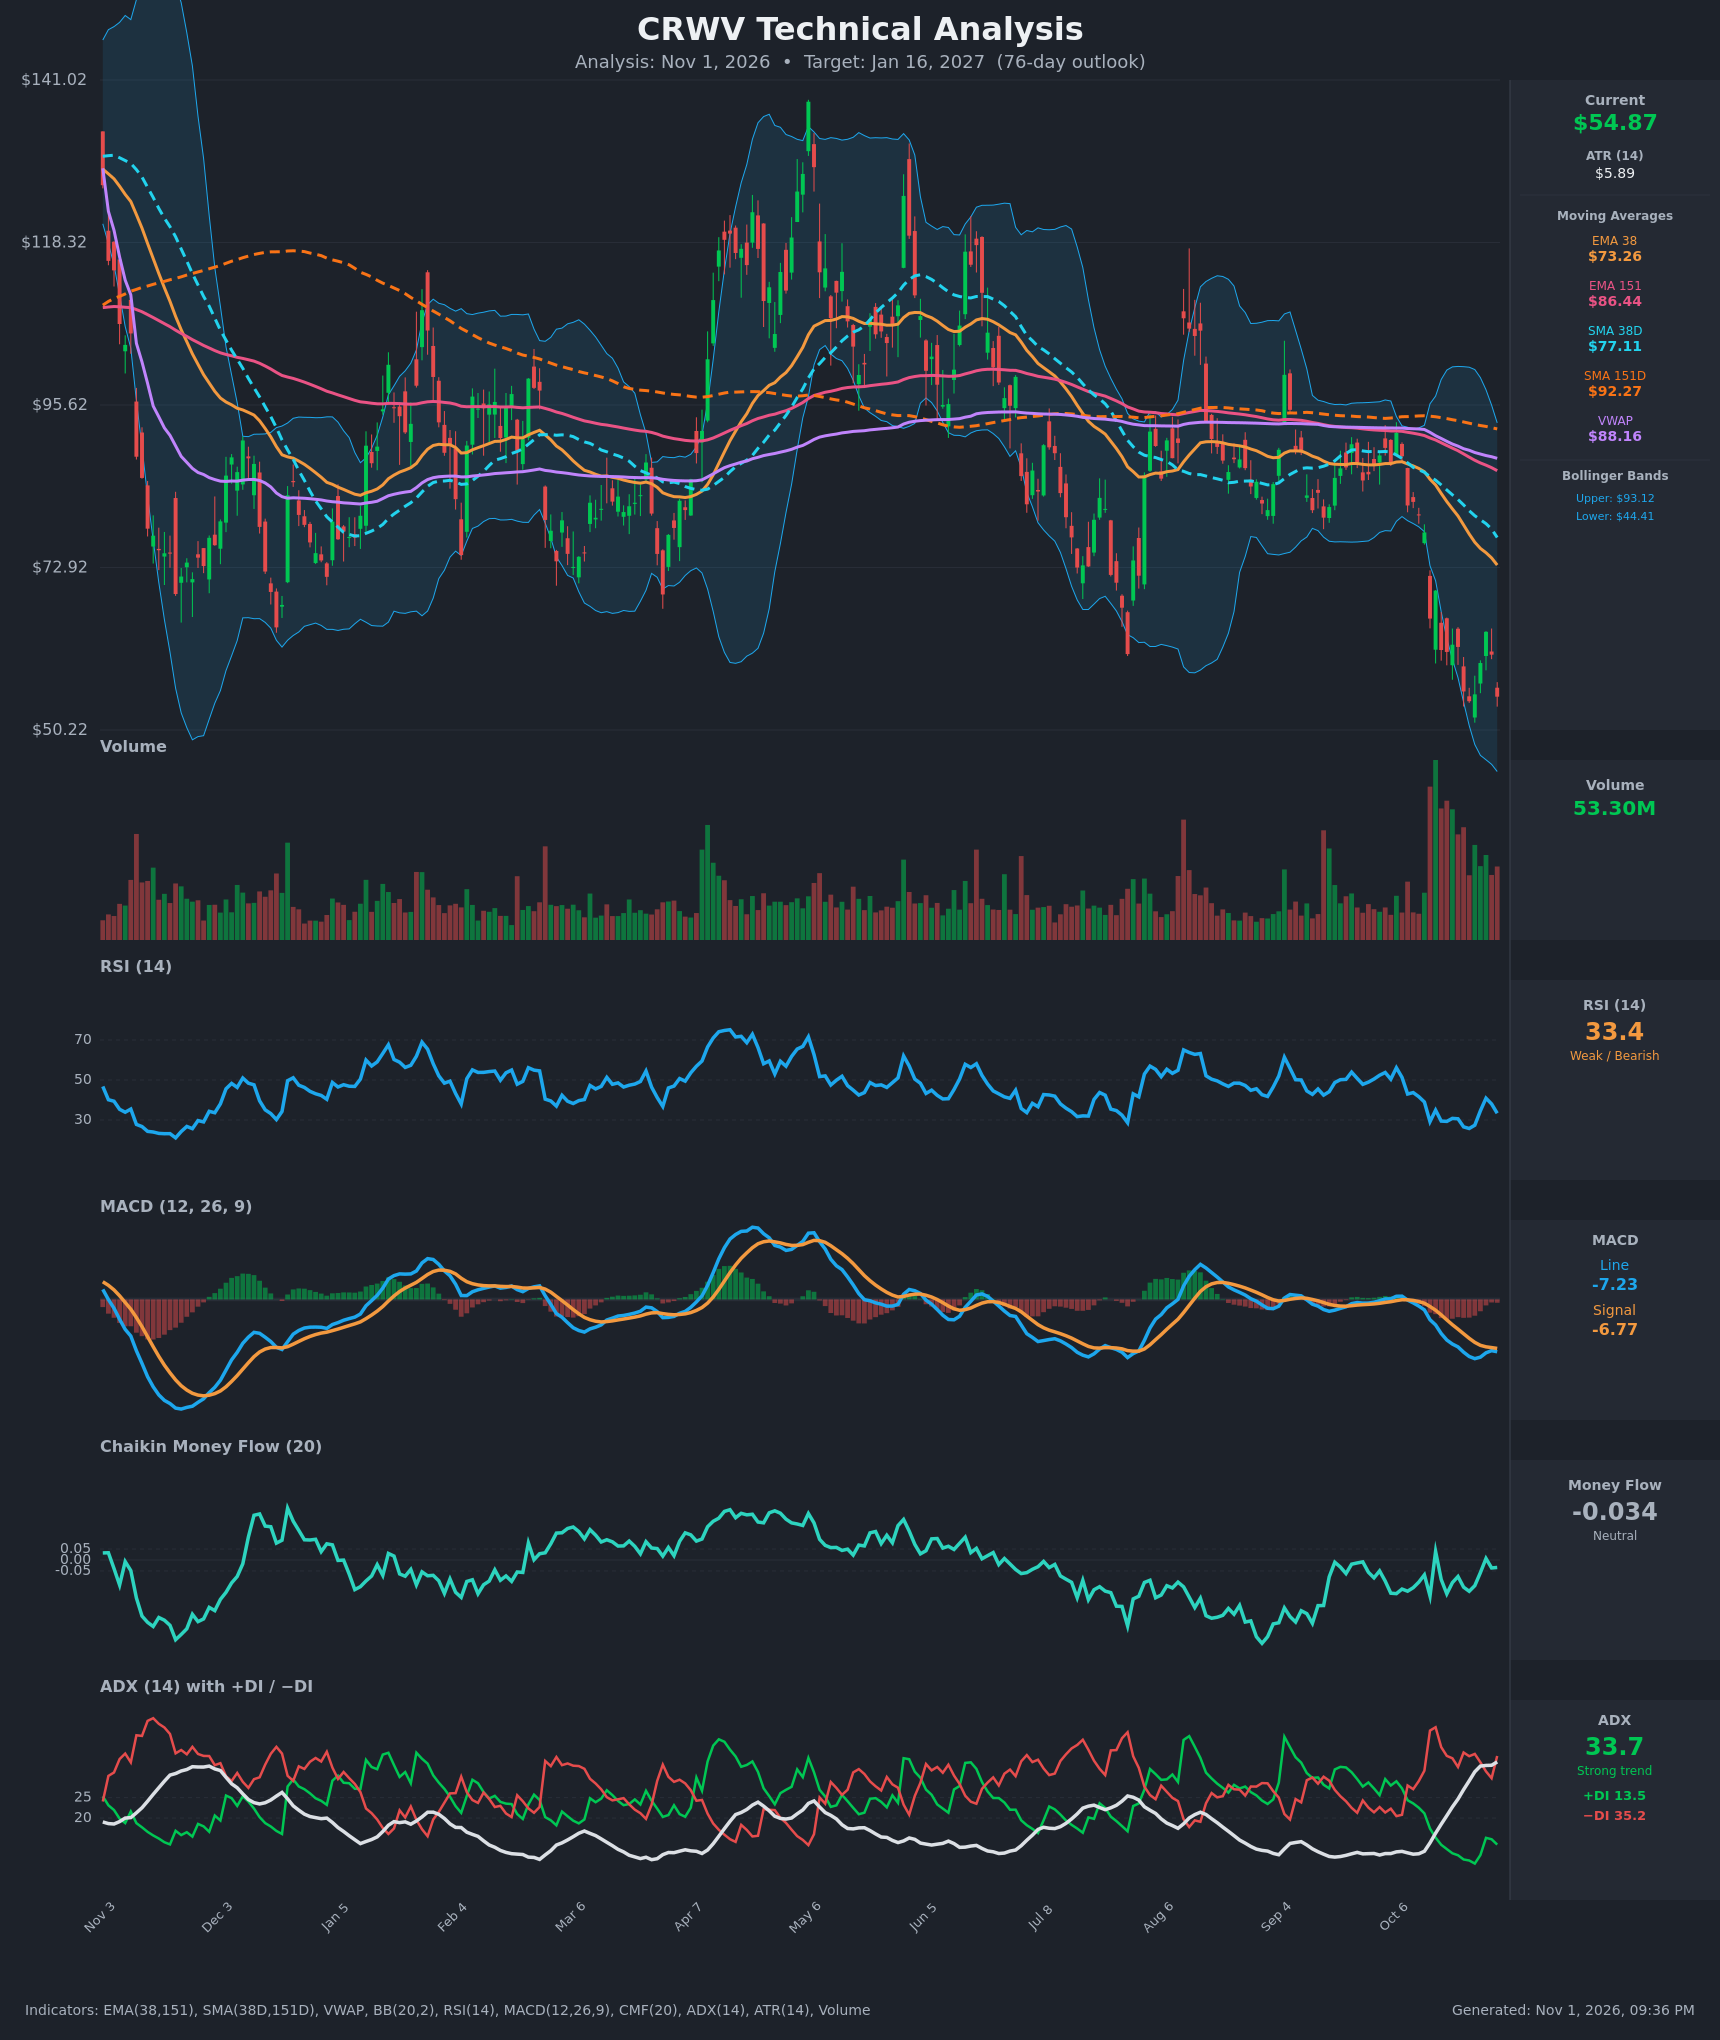
- RSI (14): 33.36, just above oversold. It bounced from 25.8 (Oct 23) to 40.9 (Oct 28) but has rolled over again to 33.4. The lower-high bounce shows momentum still tilted down, with no confirmed bullish reversal. [Bearish]
- 20 EMA (EMA 38 / EMA 151 used): EMA 38 is $73.26 and EMA 151 is $86.44. Price at $54.87 is about 25% below EMA 38 and 37% below EMA 151. Both are falling, and EMA 38 is below EMA 151 (bearish alignment), so both act as overhead resistance. [Bearish]
- MACD: Line -7.23 is below Signal -6.77, a histogram of about -0.46. The line was above the signal on Oct 27-28 only briefly in relative terms. The signal is now crossing back under, and both lines are deeply negative and near their lows. This is bearish momentum, though the stretched reading hints at possible exhaustion. [Bearish]
- Bollinger Bands (20): Upper $93.12, lower $44.41, midline about $68.77. Price is in the lower half, about 21% of the way up the band, after tagging the lower band area in late October. The bands are very wide, showing high volatility. Price is below the midline in a downtrend, so it is walking the lower half. [Bearish]
- CMF (20): -0.034, in the neutral zone (between -0.05 and +0.05). It has hovered near zero over the last two weeks, so heavy selling volume has not translated into clear distribution. There is slight selling pressure but no conviction. [Neutral]
- ADX (14): 33.7 and rising (from 11.3 on Oct 12), so the trend is strong. −DI at 35.2 is far above +DI at 13.5, so bears are firmly in control. [Strong Trend – Bearish]
- Volume: 53.30M, well above the recent average, with a volume spike during the October breakdown. Heavy volume on the decline confirms the selling, though it could also be capitulation-type volume near the lows. [Bearish confirmation / possible capitulation]
DIVERGENCES & TRENDS
- No bullish RSI divergence yet: Price made a new low at $54.23 (Oct 23) and again at $54.87, but RSI made its low of 25.8 on Oct 23 and is at 33.4 now. This is a mild bullish divergence, but it is unconfirmed.
- MACD: Both lines are falling and the signal cross is bearish. The histogram is still negative.
- Moving averages: EMA 38 is below EMA 151 and SMA 38D ($77.11) is below SMA 151D ($92.27), a death-cross configuration. Price is below SMA 151D (long-term downtrend). VWAP at $88.16 is far above price.
- ADX/DI: −DI is dominant and ADX has risen above 25, a trend-confirmation signal.
- Price action: The sharp drop from about $80 to $55 in 14 bars, with a break below the long-running $60-$65 support area from the Aug-Sep lows.
CHART PATTERNS
- Bearish continuation / breakdown: The price broke down from the multi-month range of roughly $80-$100 (Jun-Oct) and from a loosely descending structure. This resembles a Descending Triangle (flat support around $62-$65, lower highs) that has broken down.
- The measured move from the descending triangle is about the range height (roughly $95 down to $62, or about $33), projecting to about $30. This is a very extended target, so treat it as a tail.
- A Bullish Falling Wedge or Double Bottom is possible if $54 holds and price retakes $64, but this is not confirmed.
- Resistance for any bounce is at $61-$64 (prior breakdown area), then $73 (EMA 38).
POTENTIAL SCENARIOS
- Scenario 1: Bearish Trend Continuation — Strong ADX with −DI dominance and the death-cross structure favor further downside. Price breaks below $54 and slides toward the lower band. Trigger: daily close below $54.00. Target: $42-$46, with a tail to about $38. Invalidation: close above $64 (the Oct 28 high). (45% probability)
- Scenario 2: Bullish Oversold Rebound — RSI divergence and capitulation volume produce a mean-reversion bounce toward EMA 38 resistance. Trigger: close above $61.50 with MACD histogram turning up. Target: $66-$73. Invalidation: close below $52. (30% probability)
- Scenario 3: Neutral Basing Range — Price consolidates between about $48 and $64 as ADX cools. Trigger: failure to break either $54 or $64 for several weeks. Target: $52-$60. Invalidation: close outside the range. (25% probability)
PRICE TARGETS
Timeframe: 76 days (the 61-180 day band, so a width of about 18-30% of current price).
- Target Price: $50.50
- Expected Range: $40.00 to $64.00 (width $24.00, about 43.7% of the current price). Self-check: the 61-180 day guidance is 18-30%, so this is too wide. Narrowed to $42.50 to $60.00 (width $17.50, about 31.9%), close to the upper end of the band, which is justified by the ATR of $5.89 and the elevated volatility.
- Key Levels: Support at $44.41 (lower Bollinger Band), Resistance at $64.00 (prior bounce high / breakdown area)
OVERALL BIAS
OVERALL BIAS: BEARISH - ADX at 33.7 with −DI at 35.2 versus +DI at 13.5 shows a strong downtrend, with price below all key moving averages, a death-cross configuration, and a bearish MACD. The oversold RSI and neutral CMF suggest bounces are likely, but they should meet resistance at $61-$73, leaving a modest downside target.
This is educational analysis and not financial advice.