DELL 76-day bearish forecast — Nov 1, 2026
- Bias: Bearish
- Timeframe: 76 days (made Nov 1, 2026, target date Jan 15, 2027)
- Price at analysis: $424.30
- Price target: $390.00
- Expected range: $335.00 – $450.00
- Result: Pending — graded after the close on Jan 15, 2027
Get a free AI analysis of DELL today
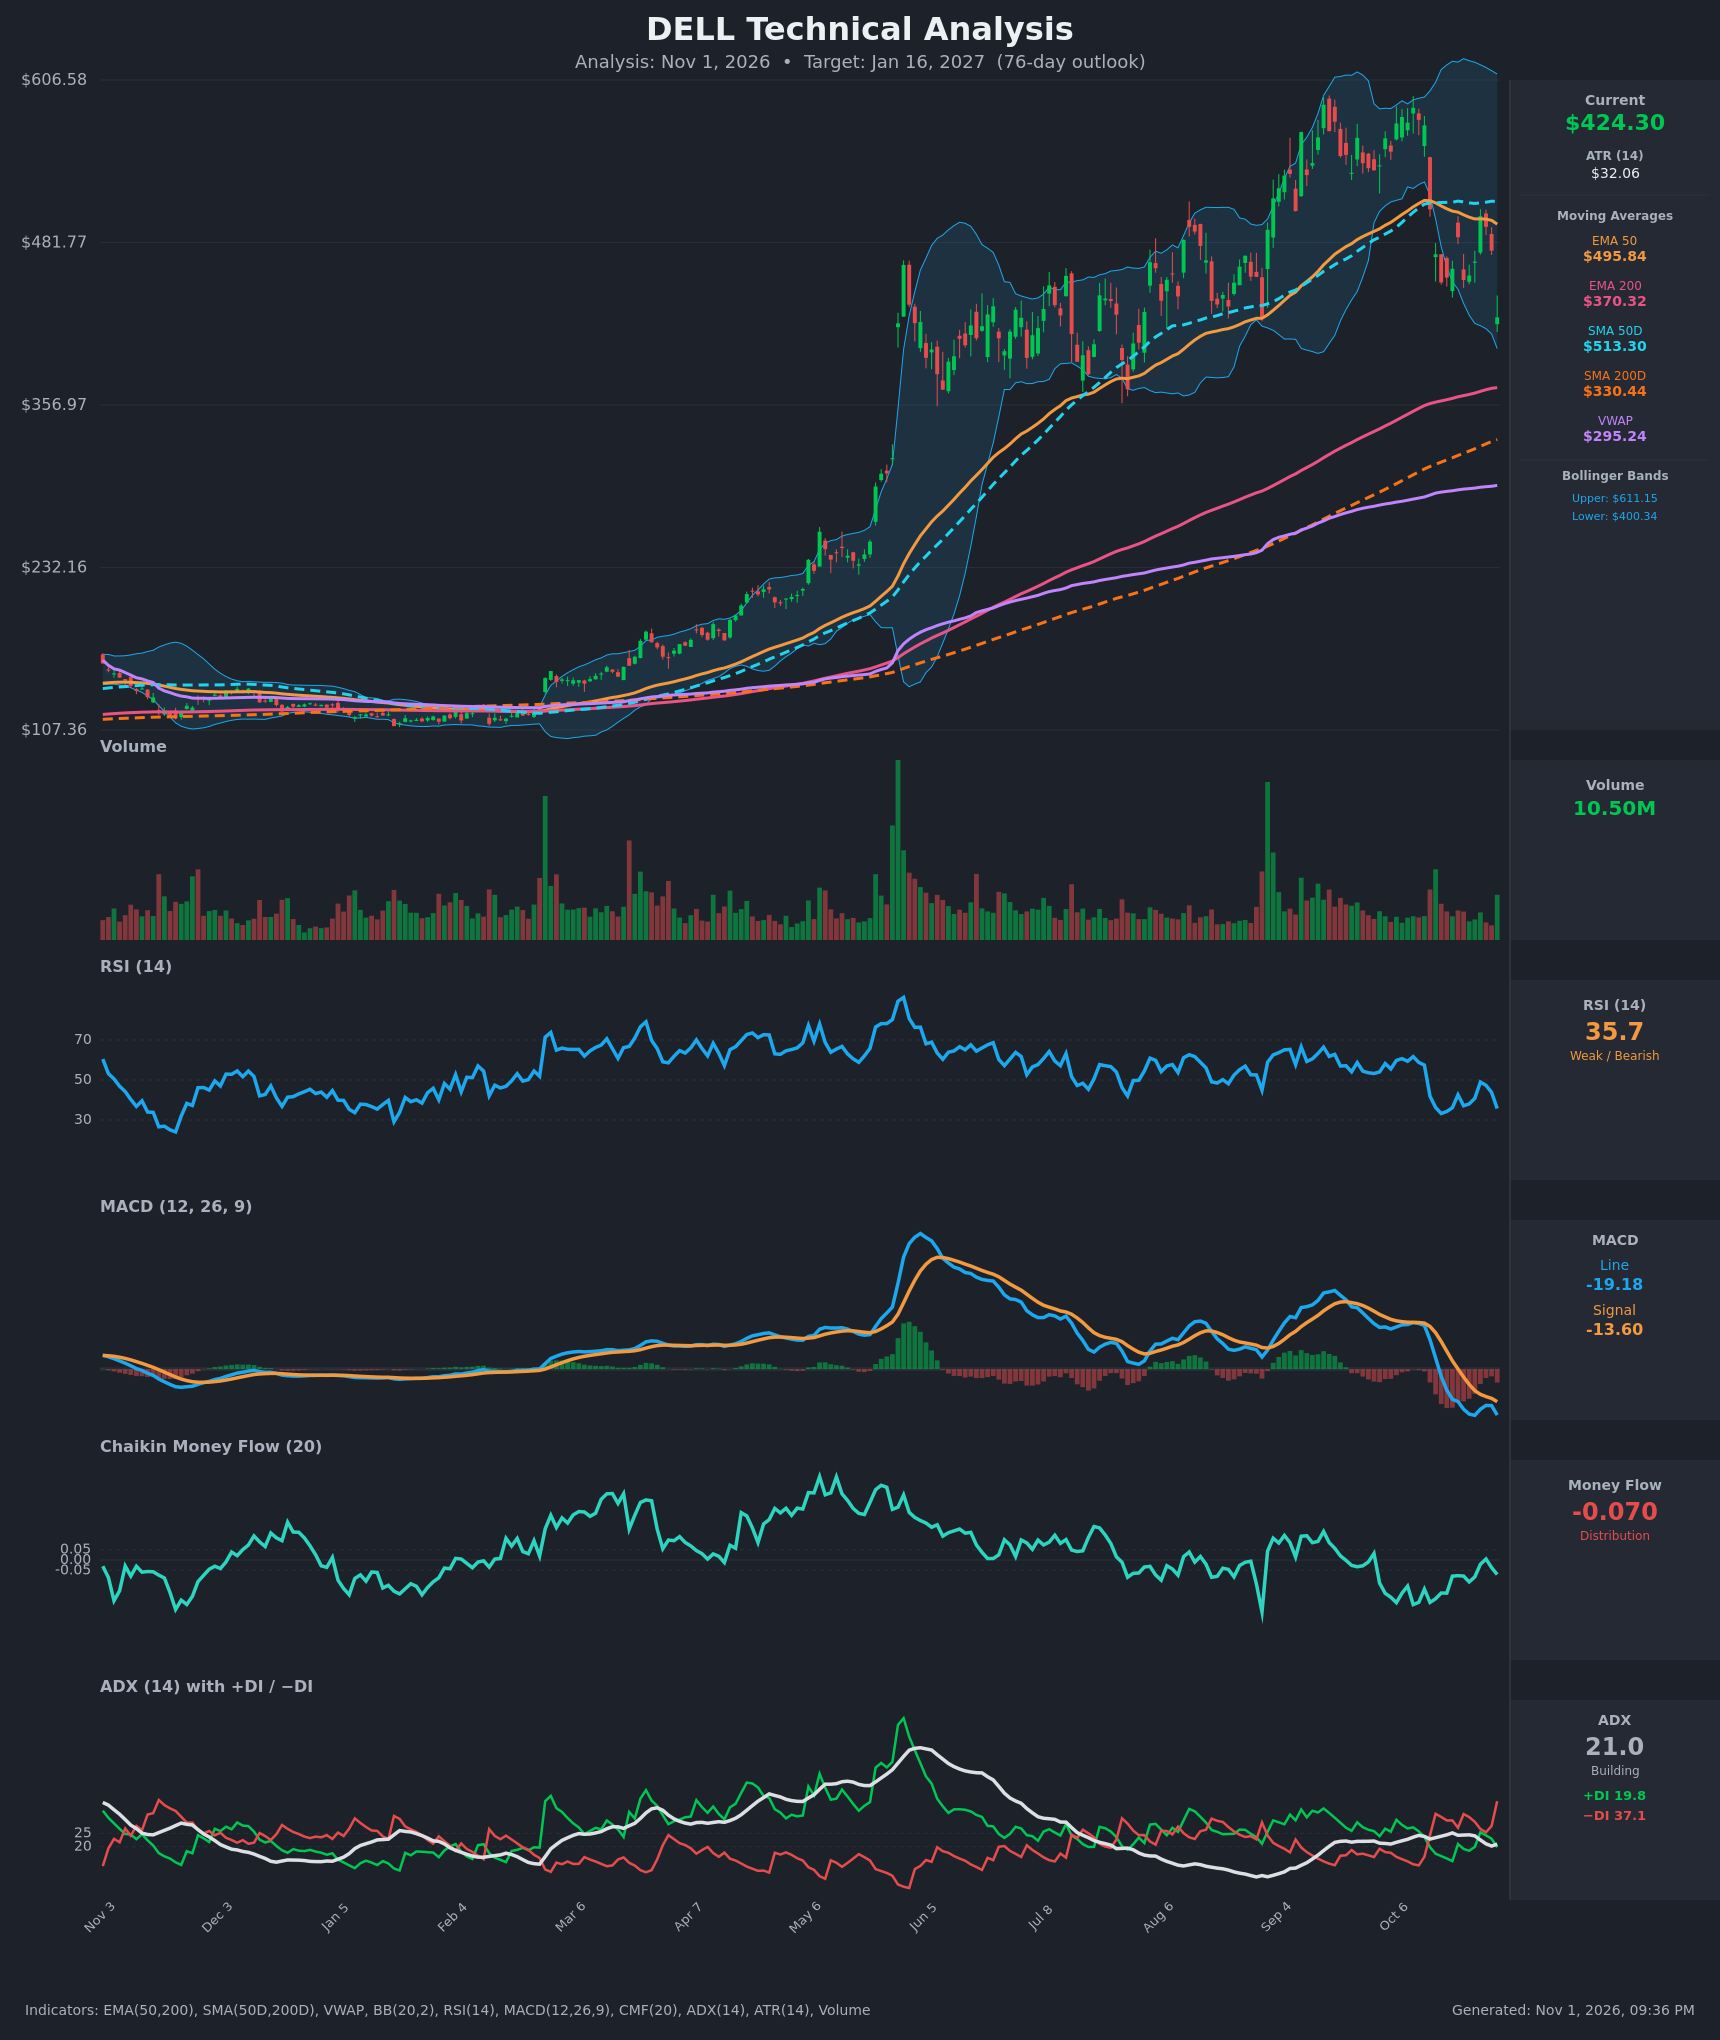
Analysis
TECHNICAL INDICATORS
- RSI (14): 35.74, down from 49 on Oct 27 and approaching oversold (<30) without reaching it. The Oct 16 low was 33.2 at a $451 close. Momentum is weak and still falling. [Bearish]
- 20 EMA: The 20 EMA is not supplied. Price at $424.30 is below the EMA 50 ($495.84) and the SMA 50D ($513.30), which are now overhead resistance. Price is still above the EMA 200 ($370.32) and SMA 200D ($330.44). [Bearish]
- MACD: Line -19.18 is below signal -13.60, so the histogram is about -5.6 and widening. The bearish crossover happened on Oct 16 and the lines are now below zero and still diverging. [Bearish]
- Bollinger Bands (20): Upper $611.15, lower $400.34, midline about $505.7. Price sits in the lower third of the bands, about $24 above the lower band, and well below the midline. The bands are wide after the rally, so volatility is elevated. A close below $400 would be a band-walk signal. [Bearish]
- CMF (20): -0.070, below the -0.05 threshold. It has been negative or flat for most of the past several weeks, so distribution is persistent. [Distribution]
- ADX (14): 21.0, just above the weak-trend zone, with −DI (37.1) far above +DI (19.8). The DI spread is wide, so sellers are clearly in control, but ADX has not confirmed a strong trend (>25). [Weak-to-Building Trend, Bearish direction]
- Volume: 10.50M on the latest bar, which is average to below average. The recent breakdown from $575 to $424 came with more selling pressure on red bars, while there was no capitulation spike like the earlier high-volume peaks. [Neutral-to-Bearish: no capitulation yet]
DIVERGENCES & TRENDS
- Mild bullish RSI divergence: price closed at $424 versus $451 on Oct 16 (a lower low), while RSI is 35.7 versus 33.2 (a higher low). This is a minor warning that downside momentum may be fading, but it is not yet confirmed by MACD or CMF.
- MACD: it made a lower low (-19.2) and has not turned up. The trend is down and the histogram is expanding.
- Moving averages: the golden cross (SMA50D > SMA200D) and EMA50 > EMA200 are still intact, so the long-term trend is up. However, price lost the 50-day averages, and the EMA 50 is rolling over from $514 to $496.
- Directional movement: −DI has crossed above +DI (Oct 14) and the gap is widening (37 vs 20).
- CMF: lower highs and persistent readings below zero show distribution after the rally.
- Price structure: a pullback of about 26% from the $575 peak in two weeks, with a lower-high sequence ($575 → $502 → $486).
CHART PATTERNS
- Bearish Double Top (reversal): peaks near $575–$590 in Sep–Oct, with the neckline near $451–$453 (the Oct 16 and Oct 22 lows). The Oct 30 close at $424 is below the neckline, so the pattern is confirmed. The measured move is about $130 of pattern height, which projects to roughly $320. That is aggressive, because the EMA 200 ($370) and SMA 200D ($330) sit in the way.
- Resistance retest: a bounce into the $451–$475 neckline zone would be the classic retest. The late-Oct bounces to $486 and $502 failed.
- Context: this is a large multi-month uptrend, so the pullback could also be a deep correction rather than a full reversal. The EMA 200 is the key line between the two.
POTENTIAL SCENARIOS
- Scenario 1: Bearish Double-Top Follow-Through to the 200-Day Zone — Price fails at the neckline retest and continues lower toward the rising EMA 200 and possibly the SMA 200D. Trigger: a daily close below the $400 lower band, or a rejection at $451–$475. Target: $370 first, then $335–$350. Invalidation: a daily close above $495 (EMA 50). (50% probability)
- Scenario 2: Neutral Consolidation Above the EMA 200 — Price holds the $370–$400 area and chops between that floor and the $450–$475 neckline while RSI resets. Trigger: stabilization above $400 with a flattening MACD histogram. Target: $380–$450 range. Invalidation: a close below $370 or above $495. (20% probability)
- Scenario 3: Bullish Relief Rally / Reclaim of the 50-Day Averages — The mild RSI divergence plays out and buyers push price back above the neckline and the EMA 50. Trigger: a close above $475 with a MACD histogram turn and improving CMF. Target: $495–$513, then $540. Invalidation: rejection at $495–$513 and a close back below $424. (30% probability)
PRICE TARGETS
For the 76-day horizon, the expected range is wide, in line with the 18–30% guidance. Range width: $450.00 − $335.00 = $115.00, or about 27% of the current price.
- Target Price: $390.00 (about -8% from $424.30)
- Expected Range: $335.00 to $450.00
- Key Levels: Support at $370.32 (EMA 200), Resistance at $451.00 (double-top neckline)
OVERALL BIAS
OVERALL BIAS: BEARISH - Price broke the double-top neckline near $451 and is below the EMA 50 and SMA 50D, with MACD below its signal and falling, −DI (37.1) far above +DI (19.8), and CMF showing distribution. Conviction is modest because the long-term trend is still up and the RSI is showing mild divergence near oversold, so the rising EMA 200 near $370 is the likely area for a reaction.
This is educational analysis and not financial advice.