F 76-day bullish forecast — Nov 1, 2026
- Bias: Bullish
- Timeframe: 76 days (made Nov 1, 2026, target date Jan 15, 2027)
- Price at analysis: $12.25
- Price target: $12.80
- Expected range: $11.20 – $14.10
- Result: Pending — graded after the close on Jan 15, 2027
Get a free AI analysis of F today
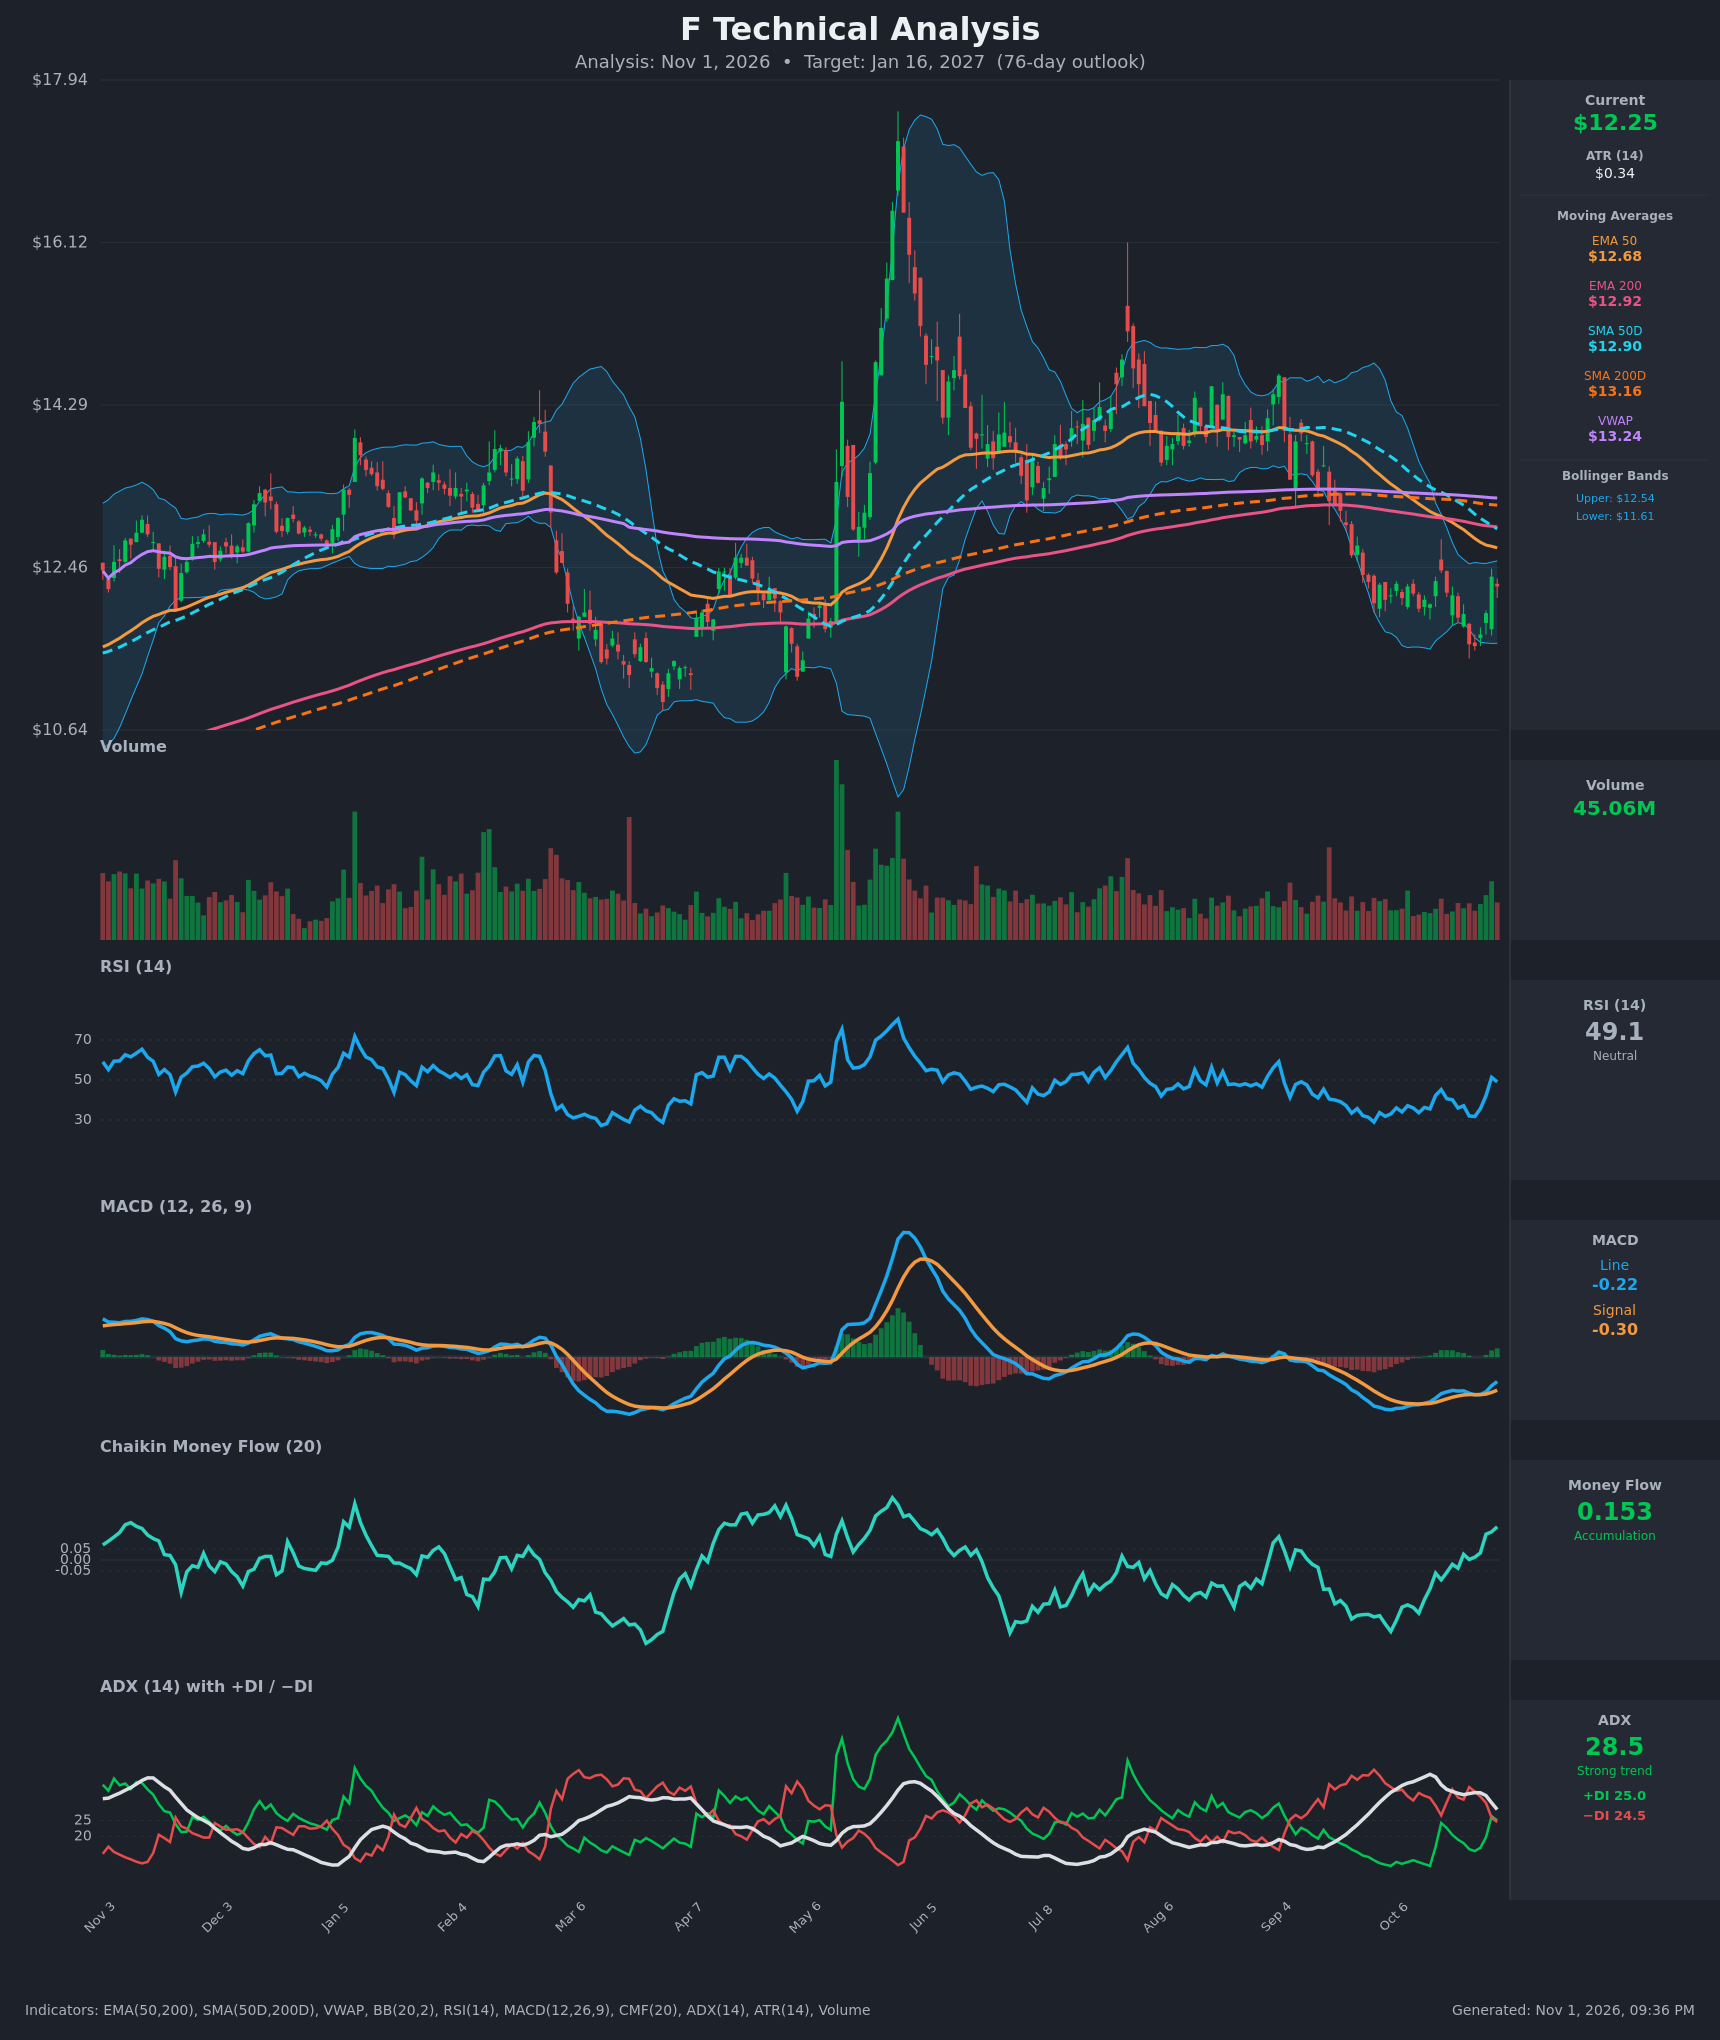
Analysis
TECHNICAL INDICATORS
- RSI (14): 49.07, up sharply from 31.7 on Oct 26 and now back at the neutral midline. Momentum is recovering from oversold but has stalled at 50 over the last two bars. [Neutral]
- 20 EMA: Not supplied. Price at $12.25 sits just above the Bollinger midline (about $12.07, a proxy for the 20-period average), which is short-term support. Price is still below EMA50 ($12.68), EMA200 ($12.92), SMA50D ($12.90), SMA200D ($13.16) and VWAP ($13.24), which stack as overhead resistance. [Neutral]
- MACD: Line -0.2226 is above signal -0.3019, a histogram of about +0.08. It crossed up around Oct 26-27 and the histogram is widening, but both lines are still below zero. [Bullish]
- Bollinger Bands (20): Upper $12.54, lower $11.61, so price is in the upper half of the bands. The bands are fairly narrow after the October selloff, and the bounce off the lower band is intact. [Bullish]
- CMF (20): 0.153, well above +0.05 and rising for several weeks, up from -0.245 on Oct 12. Buying pressure is building even though price is still below its moving averages. [Accumulation]
- ADX (14): 28.5 and falling from a 39.5 peak. +DI 25.0 and −DI 24.5 have just converged after +DI crossed up from 11.9 to 25.0, so the prior downtrend is losing strength and control is roughly even. [Strong but fading trend, direction turning neutral/bullish]
- Volume: 45.06M, with a green volume bar on the latest bounce. The recent up days came on healthy volume, a modest sign of buyer participation. [Mildly Bullish]
DIVERGENCES & TRENDS
- Bullish divergence: CMF is rising strongly and RSI and MACD are making higher lows while price is still near its lows. Price made a lower low around $11.58 against the earlier Aug-Sep range, but money flow did not confirm it.
- MACD: The bullish crossover occurred in late October. A move through zero would confirm it.
- ADX/DI: −DI dominated for weeks (33.7 vs 11.9 on Oct 12). The DI spread has now fully closed, so bears have lost control, but bulls have not taken over.
- Long-term trend: The EMA50 is below the EMA200, and the SMA50D (12.90) is below the SMA200D (13.16). Both are death-cross configurations. Price is below the SMA200D, so the long-term trend is still down. The EMA50 and SMA50D are curling flatter.
- Moving averages: Price is hugging the 12.68-12.92 cluster from below. Reclaiming it would be a key trend-change signal.
CHART PATTERNS
- Bullish Double Bottom (developing, unconfirmed): Lows near $11.58 (Oct 23-26) followed by a bounce to about $12.4. The neckline sits near $12.45-12.55, so a close above it would target about $13.30-13.50 (measured move). That target is also near the VWAP and SMA200D.
- Bearish risk: The October decline from about $14 resembles a bearish continuation. If the bounce fails below the 12.68-12.92 moving-average cluster, it would be a lower high, with $11.58 as the key floor and the next target near $10.90 (the April low area).
- Overall: The structure is a base-building attempt inside a larger downtrend, not yet a confirmed reversal.
POTENTIAL SCENARIOS
- Scenario 1: Bullish Base Breakout and Mean Reversion — The double-bottom base holds, CMF accumulation continues, and price reclaims the 12.68-12.92 moving-average cluster, then drifts toward the SMA200D/VWAP zone. Trigger: daily close above $12.55 (the BB upper and neckline), then above $12.92. Target: $13.20-13.50. Invalidation: close below $11.58. (47% probability)
- Scenario 2: Bearish Failed Bounce — Price stalls under the EMA50/EMA200 and SMA cluster. Death-cross configurations and the long-term downtrend reassert, and −DI retakes the lead. Trigger: rejection at $12.68-$12.92 and a close below $11.90. Target: $11.30, then $10.90. Invalidation: close above $13.00. (30% probability)
- Scenario 3: Neutral Range — Price chops between $11.60 and $12.90 as ADX fades and the moving averages converge. Trigger: repeated failures at both ends of the range. Target: $12.00-12.60. Invalidation: close outside $11.55-$13.00. (23% probability)
PRICE TARGETS
- Target Price: $12.80 (76-day, Jan 16, 2027)
- Expected Range: $11.20 to $14.10 (width $2.90, about 23.7% of current price, consistent with the 61-180 day guidance)
- Key Levels: Support at $11.58, Resistance at $12.92
OVERALL BIAS
OVERALL BIAS: BULLISH - A bullish MACD crossover, strong CMF accumulation (0.153), RSI recovering from oversold, and a convergence of +DI/−DI after the selloff point to a developing base. Price must reclaim the $12.68-$12.92 moving-average cluster for the bounce to confirm; the death-cross configurations keep conviction modest.
This is educational analysis and not financial advice.