HOOD 76-day bearish forecast — Nov 1, 2026
- Bias: Bearish
- Timeframe: 76 days (made Nov 1, 2026, target date Jan 15, 2027)
- Price at analysis: $84.99
- Price target: $78.00
- Expected range: $68.00 – $90.00
- Result: Pending — graded after the close on Jan 15, 2027
Get a free AI analysis of HOOD today
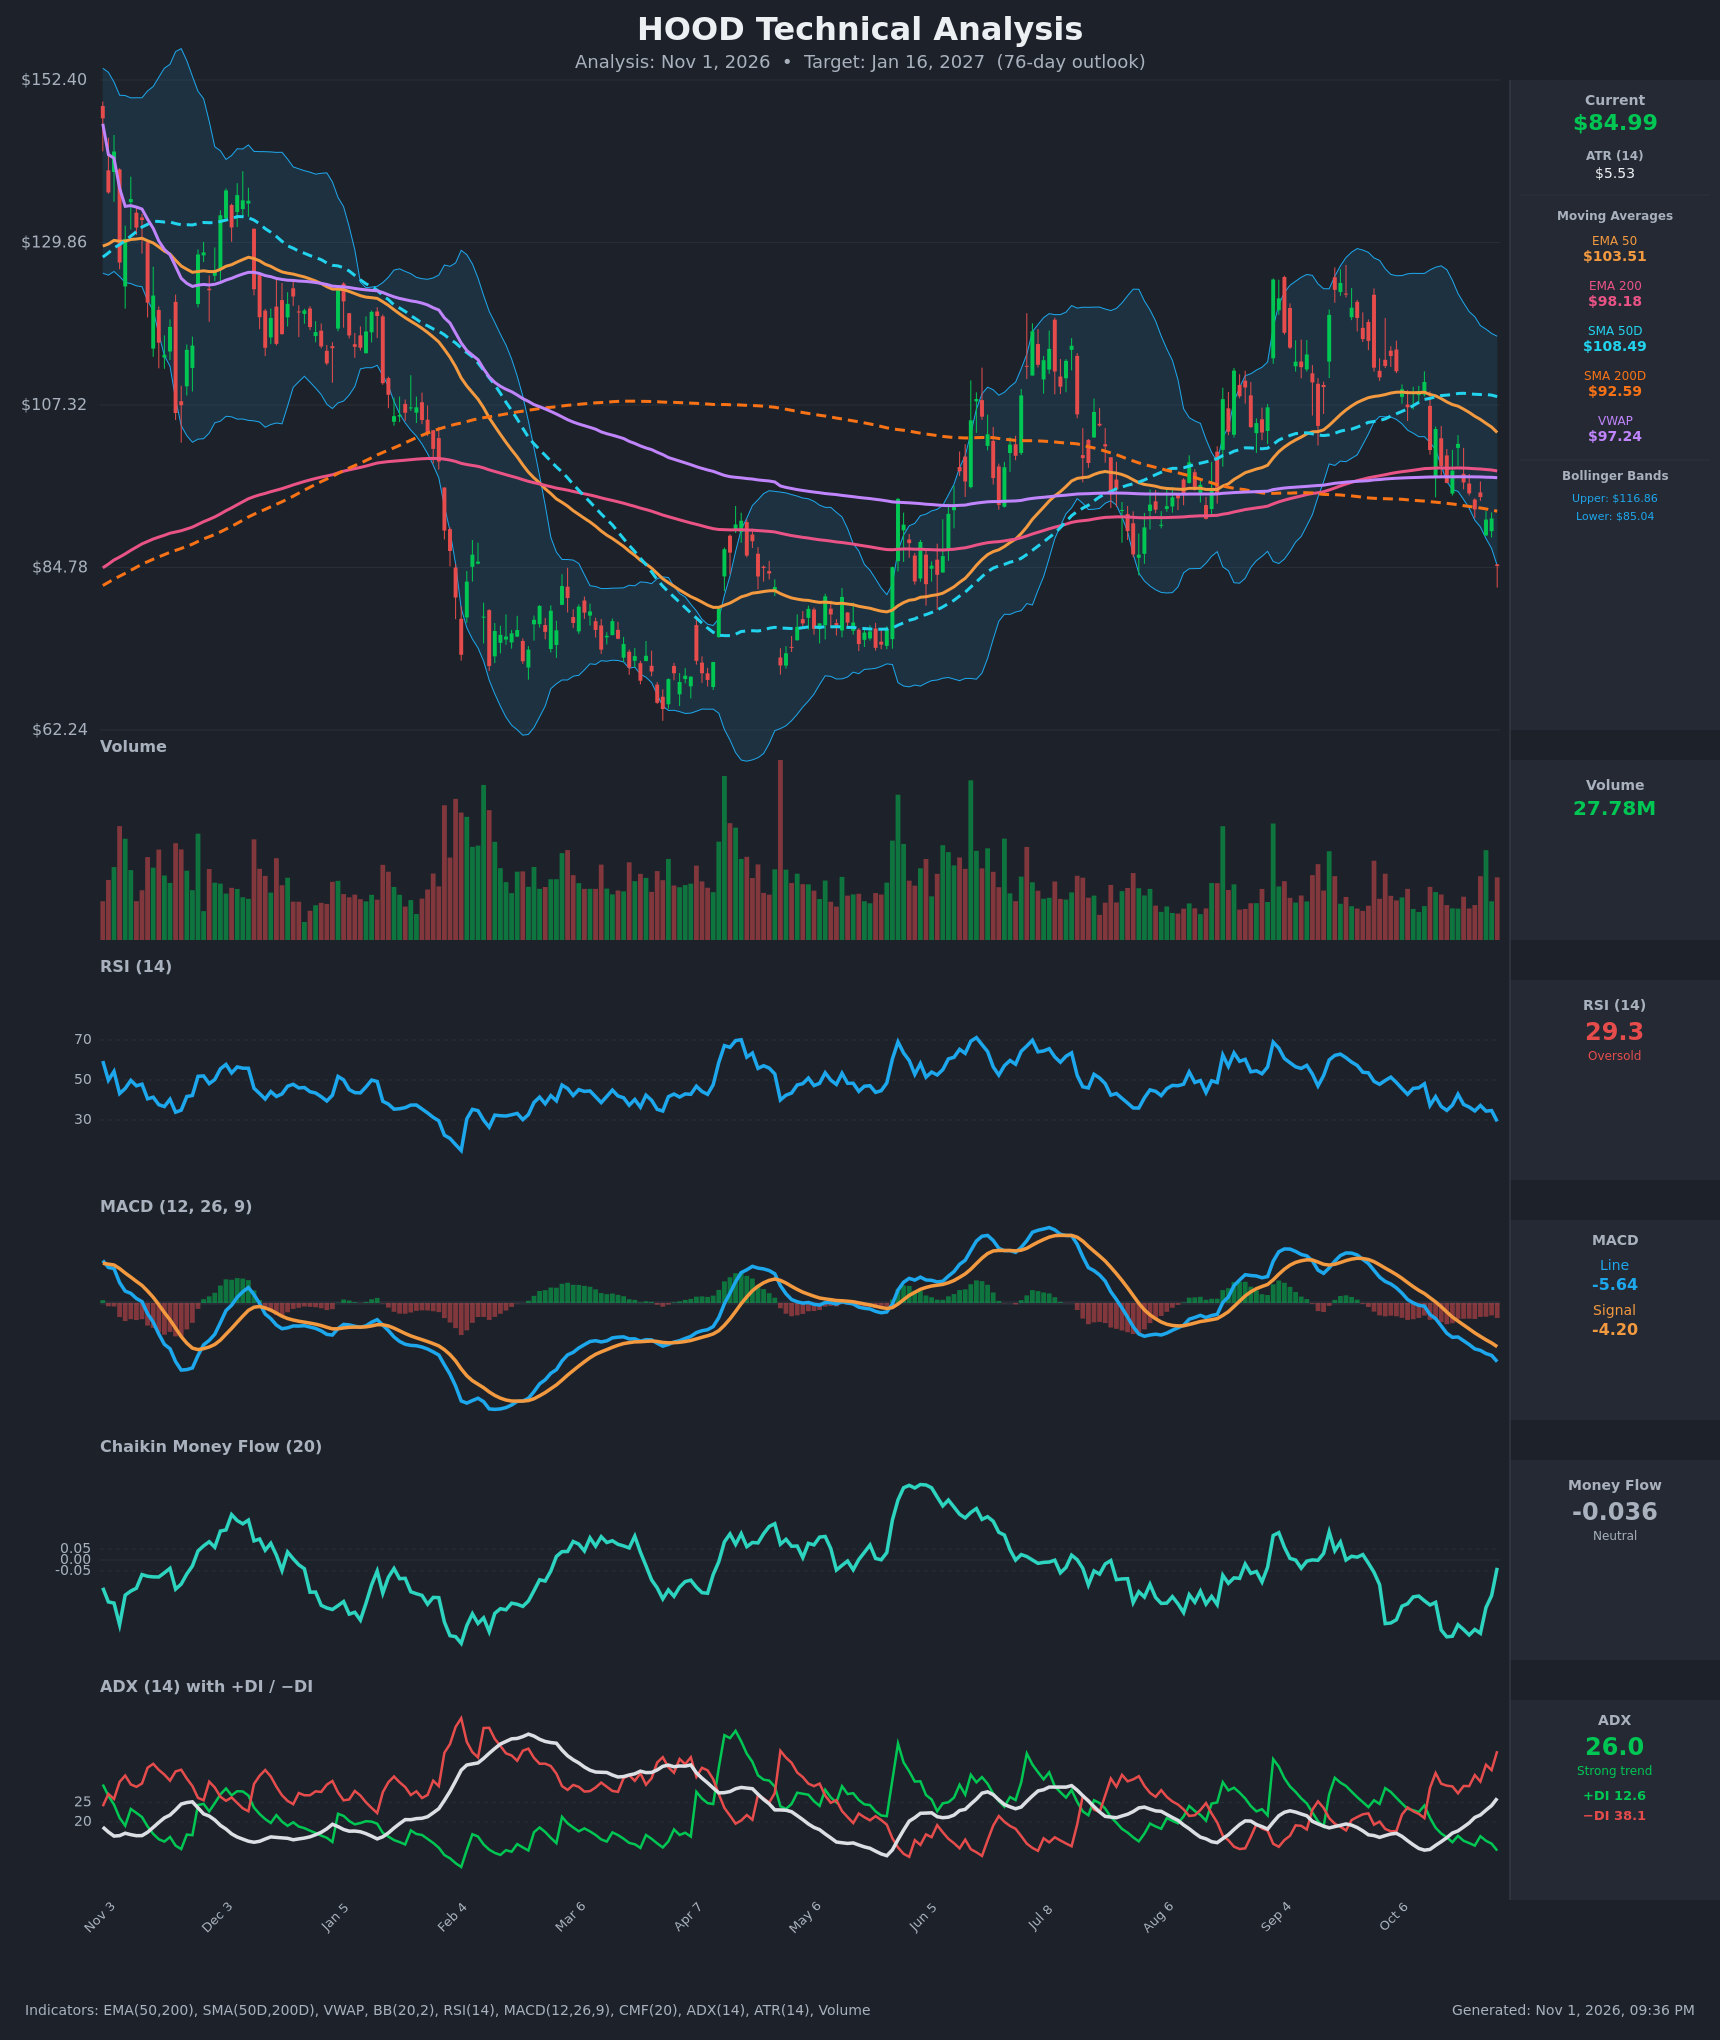
Analysis
TECHNICAL INDICATORS
- RSI (14): 29.3, in oversold territory (<30) after sliding from 48 on Oct 13. Momentum is still pointing down, with no bullish turn yet. Oversold readings in a strong downtrend can persist, but they also raise the odds of a relief bounce. [Bearish]
- 20 EMA: The 20 EMA isn't supplied, so I used the EMA 50 at $103.51 and EMA 200 at $98.18. Price at $84.99 is about 18% below the EMA 50 and 13% below the EMA 200, and both now act as overhead resistance. The EMA 50 is falling steadily (109.0 → 103.5 in 15 bars). [Bearish]
- MACD: The line is at -5.64 and the signal at -4.20. The bearish crossover happened around Oct 16, and the gap has widened since, so the histogram is increasingly negative. Momentum is still deteriorating, with no sign of a bottom. [Bearish]
- Bollinger Bands (20): Price at $84.99 sits just below the lower band ($85.04). The upper band is $116.86, so the bands are wide and volatility has expanded. A close at or outside the lower band in a trending market signals a strong downtrend ("walking the band"), though it is also stretched enough for a snap-back toward the mid-band (~$101). [Bearish]
- CMF (20): -0.036, which is neutral (between ±0.05). It has improved sharply from -0.35 on Oct 19 and the chart shows it hooking up, so selling pressure is fading even as price makes new lows. This is an early bullish divergence, though it is not yet accumulation. [Neutral]
- ADX (14): 26.0 and rising from 13 two weeks ago, so the trend is strong. −DI at 38.1 is far above +DI at 12.6, meaning the bears are firmly in control. [Strong Trend – Bearish]
- Volume: 27.78M, with the latest candle a large red bar on elevated volume and a long lower wick. This is a heavy-volume breakdown with some sign of capitulation, but there is no confirmed reversal yet. [Bearish with possible capitulation]
DIVERGENCES & TRENDS
- Price vs. CMF: Price made a new low while CMF rose from -0.35 to -0.04. This is a mild bullish divergence in volume flow and a caution flag for shorts.
- Price vs. RSI/MACD: There is no divergence. RSI is at its lowest since early in the year and MACD is making new lows, so momentum confirms the price drop.
- Moving averages:
- Price is below the SMA 200D ($92.59), EMA 200, EMA 50, SMA 50D and VWAP ($97.24), so every trend filter is bearish.
- There is no death cross yet. SMA 50D ($108.49) is above SMA 200D ($92.59), but the gap is narrowing and the SMA 50D has started to roll over.
- The EMA 50 is above the EMA 200, but the spread has shrunk from ~$10.7 to ~$5.3 in two weeks. An EMA death cross is possible within the 76-day window.
- ADX/DI: The −DI crossed above +DI on Oct 14 and the gap has kept widening. ADX has turned up through 25, which confirms the downtrend.
- Key break: Price has broken below the Aug–Sep range lows near $85, the base of a multi-month range.
CHART PATTERNS
- Bearish Double Top / Triple Top (loose): There are highs around $120–$130 (June, July, September) with a neckline near $85 (the August low). Price is now testing and slightly breaching that neckline. The textbook measured move ($128 – $85 ≈ $43) points toward the low-$40s, but I treat it as a long-term outer boundary and not a 76-day target.
- Bearish continuation structure: The lower highs since September ($128 → ~$110 → ~$103) and the steep Oct 14 gap-down look like a bearish flag/pennant resolving lower.
- Prior structure as support: The $70–$78 zone (April–June consolidation) is the next logical support. A bounce from here would be a relief rally into the $92–$98 MA cluster, which should cap it.
POTENTIAL SCENARIOS
- Scenario 1: Bearish Neckline Breakdown Continuation — Price loses the $85 neckline and the strong −DI-led trend carries it into the prior $70–$78 base, helped by an EMA death cross. Trigger: daily close below $83 with MACD still falling. Target: $75–$78, with an extension to $70. Invalidation: a daily close back above $92.60 (SMA 200D). (50% probability)
- Scenario 2: Bullish Oversold Relief Rally — RSI under 30 at the lower Bollinger Band with CMF turning up produces a mean-reversion bounce back to the VWAP and 200-day averages, but it fails below the EMA 50. Trigger: reclaim of $88–$90 on rising volume with a MACD histogram turn. Target: $95–$100 (EMA 200/VWAP). Invalidation: a close below $80. (35% probability)
- Scenario 3: Neutral Base Building — Price chops between ~$75 and ~$92 as volatility contracts. Trigger: ADX falls back below 20 and RSI stays at 35–50. Target: ~$80–$88. Invalidation: a close outside the $75–$92 range. (15% probability)
PRICE TARGETS
- Target Price: $78.00 (76-day, Jan 16, 2027)
- Expected Range: $68.00 to $90.00. The width is $22, about 25.9% of the current price, which fits the 61–180 day guidance (18–30%).
- Key Levels: Support at $75.00, Resistance at $92.60
OVERALL BIAS
OVERALL BIAS: BEARISH - Price has broken below the multi-month range low near $85 and sits below every moving average and VWAP. MACD is falling, and ADX is rising to 26 with −DI (38.1) far above +DI (12.6). The oversold RSI and improving CMF raise the risk of a relief bounce, but the $92–$98 resistance cluster should cap rallies and favor a drift toward the $75–$78 area.
This is educational analysis and not financial advice.