IBM 76-day bullish forecast — Nov 1, 2026
- Bias: Bullish
- Timeframe: 76 days (made Nov 1, 2026, target date Jan 15, 2027)
- Price at analysis: $257.81
- Price target: $272.00
- Expected range: $236.00 – $294.00
- Result: Pending — graded after the close on Jan 15, 2027
Get a free AI analysis of IBM today
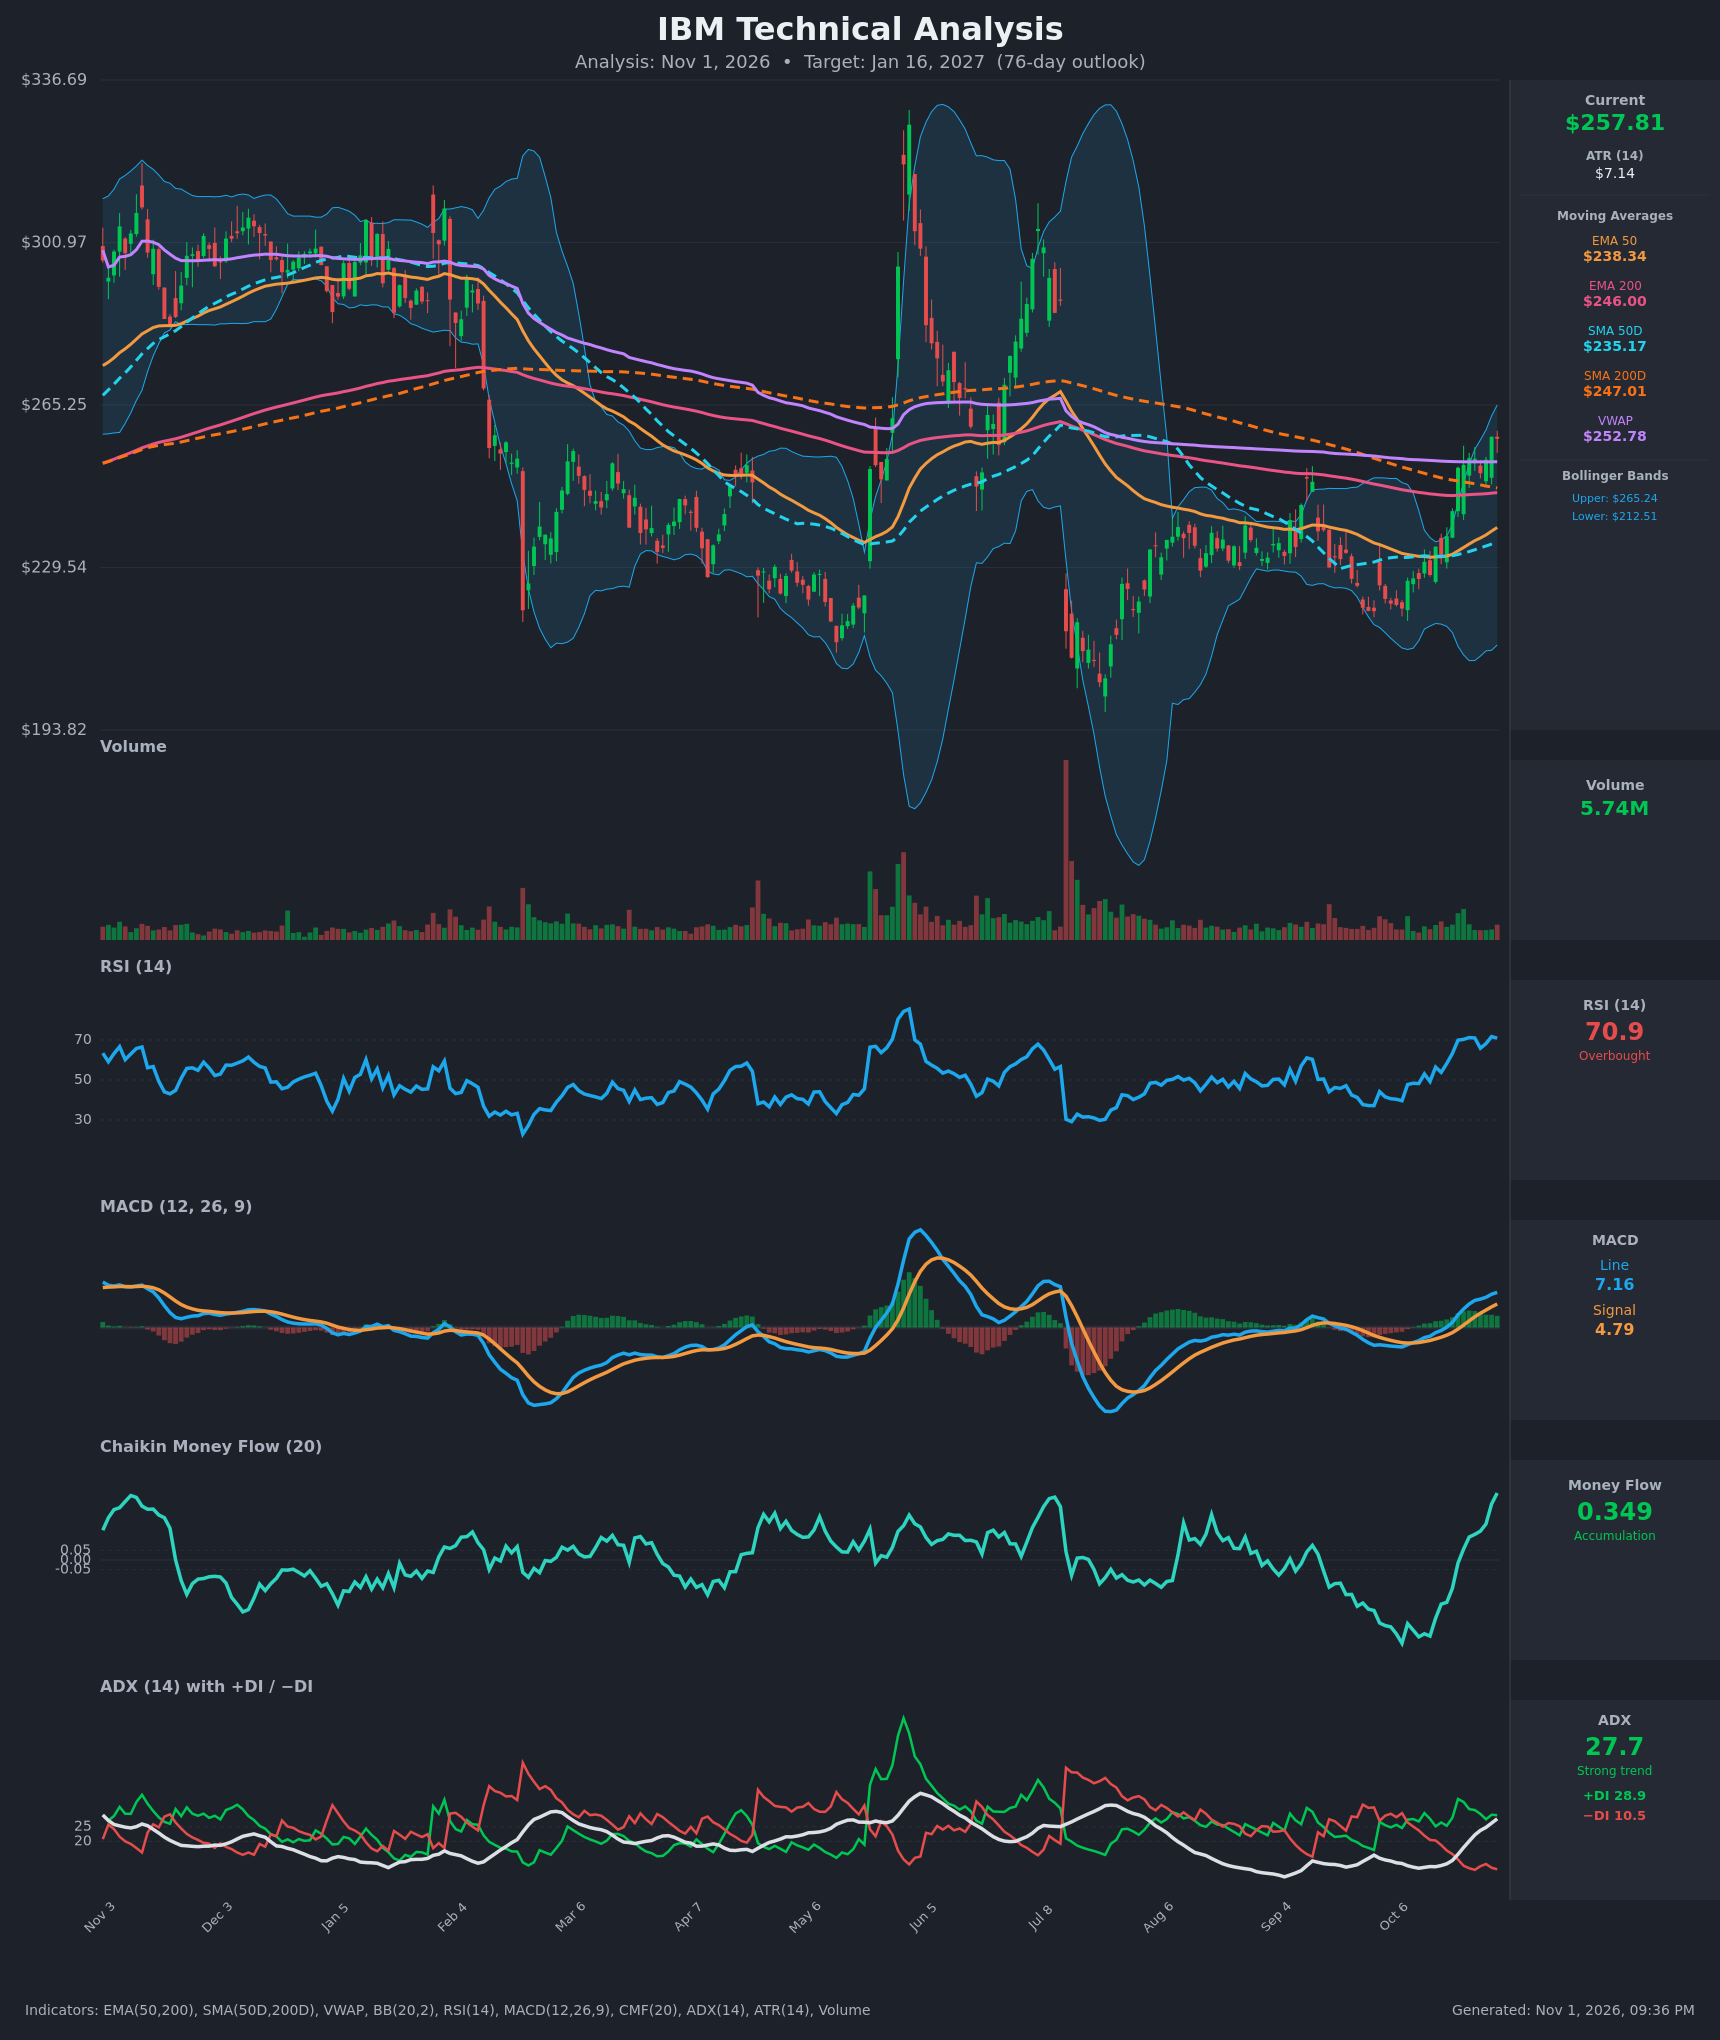
Analysis
TECHNICAL INDICATORS
- RSI (14): 70.92, just into overbought territory after climbing from 48 on Oct 12 to about 71 now. Momentum is strong, but the reading raises the odds of a near-term pause. Overbought readings in a new trend can persist. [Bullish]
- 20 EMA: Not supplied. Using the EMA 50 ($238.34) as the proxy, price is about 8% above it and the EMA is rising, so it acts as dynamic support. The EMA 50 is still below the EMA 200 ($246.00), though the gap is narrowing. [Bullish]
- MACD: Line 7.16 is above signal 4.79 and both are positive. The bullish crossover came on Oct 19-20, and the histogram has been expanding since, with the line still rising. [Bullish]
- Bollinger Bands (20): Upper $265.24, lower $212.51, so price sits in the upper quarter of the bands, about $7.40 (roughly 1 ATR) below the upper band. The bands are wide from earlier volatility, leaving room to run. The upper band is the first resistance test, and a walk along it would confirm strength. [Bullish]
- CMF (20): 0.349, strong accumulation. It climbed from -0.40 on Oct 12 to well above +0.05, a sharp and sustained improvement in buying pressure. It is the highest reading on the chart. [Accumulation]
- ADX (14): 27.7 and rising (from 10.8 on Oct 12), above the 25 trend threshold. +DI at 28.9 is far above −DI at 10.5, so bulls are firmly in control and a fresh uptrend is confirmed. [Strong Trend + Bullish]
- Volume: 5.74M, average to slightly below average. The advance is not backed by an obvious volume surge (the mid-October breakout bar was modestly elevated), so confirmation is only moderate. This is a minor caution, partly offset by CMF showing accumulation. [Neutral to mildly supportive]
DIVERGENCES & TRENDS
- There is no bearish RSI/price divergence. RSI, MACD, CMF and ADX all made higher highs alongside price, which confirms the move.
- Price has reclaimed every key level: the EMA 50, SMA 50D ($235.17), EMA 200 ($246.00), SMA 200D ($247.01) and VWAP ($252.78). All five now sit below price. The $247 area is now the main support.
- The SMA50D/SMA200D relationship is still a death-cross configuration (235.17 vs 247.01), but the gap has narrowed from the large spread of recent months. A golden cross is possible within the 76-day window if price holds up.
- ADX rose from the low teens to 27.7 while −DI collapsed, which is a trend-initiation signal.
- The larger structure is a downtrend of lower highs from the $300+ area in the first half of the chart, with a spike to about $330 in June that was fully retraced. Overhead supply sits near $265-$300.
- Price is stretched: RSI is above 70 and price is 8% above the EMA 50. A consolidation or pullback toward $247-$253 would be normal.
CHART PATTERNS
- The chart shows a multi-month base with higher lows (about $205 in July/August, then about $220 in October) and a breakout above the $247-$253 moving-average cluster. This resembles a Bullish Double Bottom / rounded reversal, and loosely a Bullish Falling Wedge breakout, since the downtrend channel was broken to the upside.
- The pattern is not fully confirmed until price clears the $265 neckline-type resistance (upper Bollinger Band and the prior congestion area). The measured move from the base (about $220 to $265) projects to about $285-$290.
- The reversal is young, and the long-term series of lower highs argues for caution near $265-$280.
POTENTIAL SCENARIOS
- Scenario 1: Bullish Breakout and Trend Continuation — Price shallow-pulls back, holds above the VWAP/SMA200 zone, then breaks the upper Bollinger Band and the $265 resistance. CMF and ADX support follow-through, and the EMA 50 / SMA 50D move toward their long-term counterparts. Trigger: daily close above $265.25 with volume expansion. Target: $275-$288. Invalidation: daily close below $247. (50% probability)
- Scenario 2: Bearish Overbought Reversal / Failed Breakout — RSI is above 70 into the upper band and overhead supply. Price rolls over, loses the VWAP, and fills back into the old base. Trigger: close below $252.78, then below $247. Target: $230-$238 (EMA 50 / SMA 50D zone). Invalidation: reclaim of $265. (28% probability)
- Scenario 3: Neutral Consolidation — Price digests the rally between about $248 and $268 as the moving averages catch up. Trigger: failure to close above $265 or below $247 for several weeks. Target: $255-$262. Invalidation: close outside the $247-$268 range. (22% probability)
PRICE TARGETS
For the 76-day horizon (to about Jan 16, 2027):
- Target Price: $272.00
- Expected Range: $236.00 to $294.00 (width $58, about 22.5% of current price, consistent with the 18-30% guidance for 61-180 days)
- Key Levels: Support at $252.78 (VWAP; next at $247.01, the SMA 200D), Resistance at $265.24 (upper Bollinger Band; next near $285-$290)
OVERALL BIAS
OVERALL BIAS: BULLISH - Price has reclaimed all major moving averages and VWAP, with a MACD bullish crossover, ADX at 27.7 with +DI far above −DI, and strong CMF accumulation (0.349). The main risks are overbought RSI near the $265 band and the longer-term lower-high structure, so a pullback toward $247-$253 would be a normal retest before the move continues.
This is educational analysis and not financial advice.