NFLX 76-day bearish forecast — Nov 1, 2026
- Bias: Bearish
- Timeframe: 76 days (made Nov 1, 2026, target date Jan 15, 2027)
- Price at analysis: $62.08
- Price target: $58.50
- Expected range: $50.50 – $69.00
- Result: Pending — graded after the close on Jan 15, 2027
Get a free AI analysis of NFLX today
Analysis
TECHNICAL INDICATORS
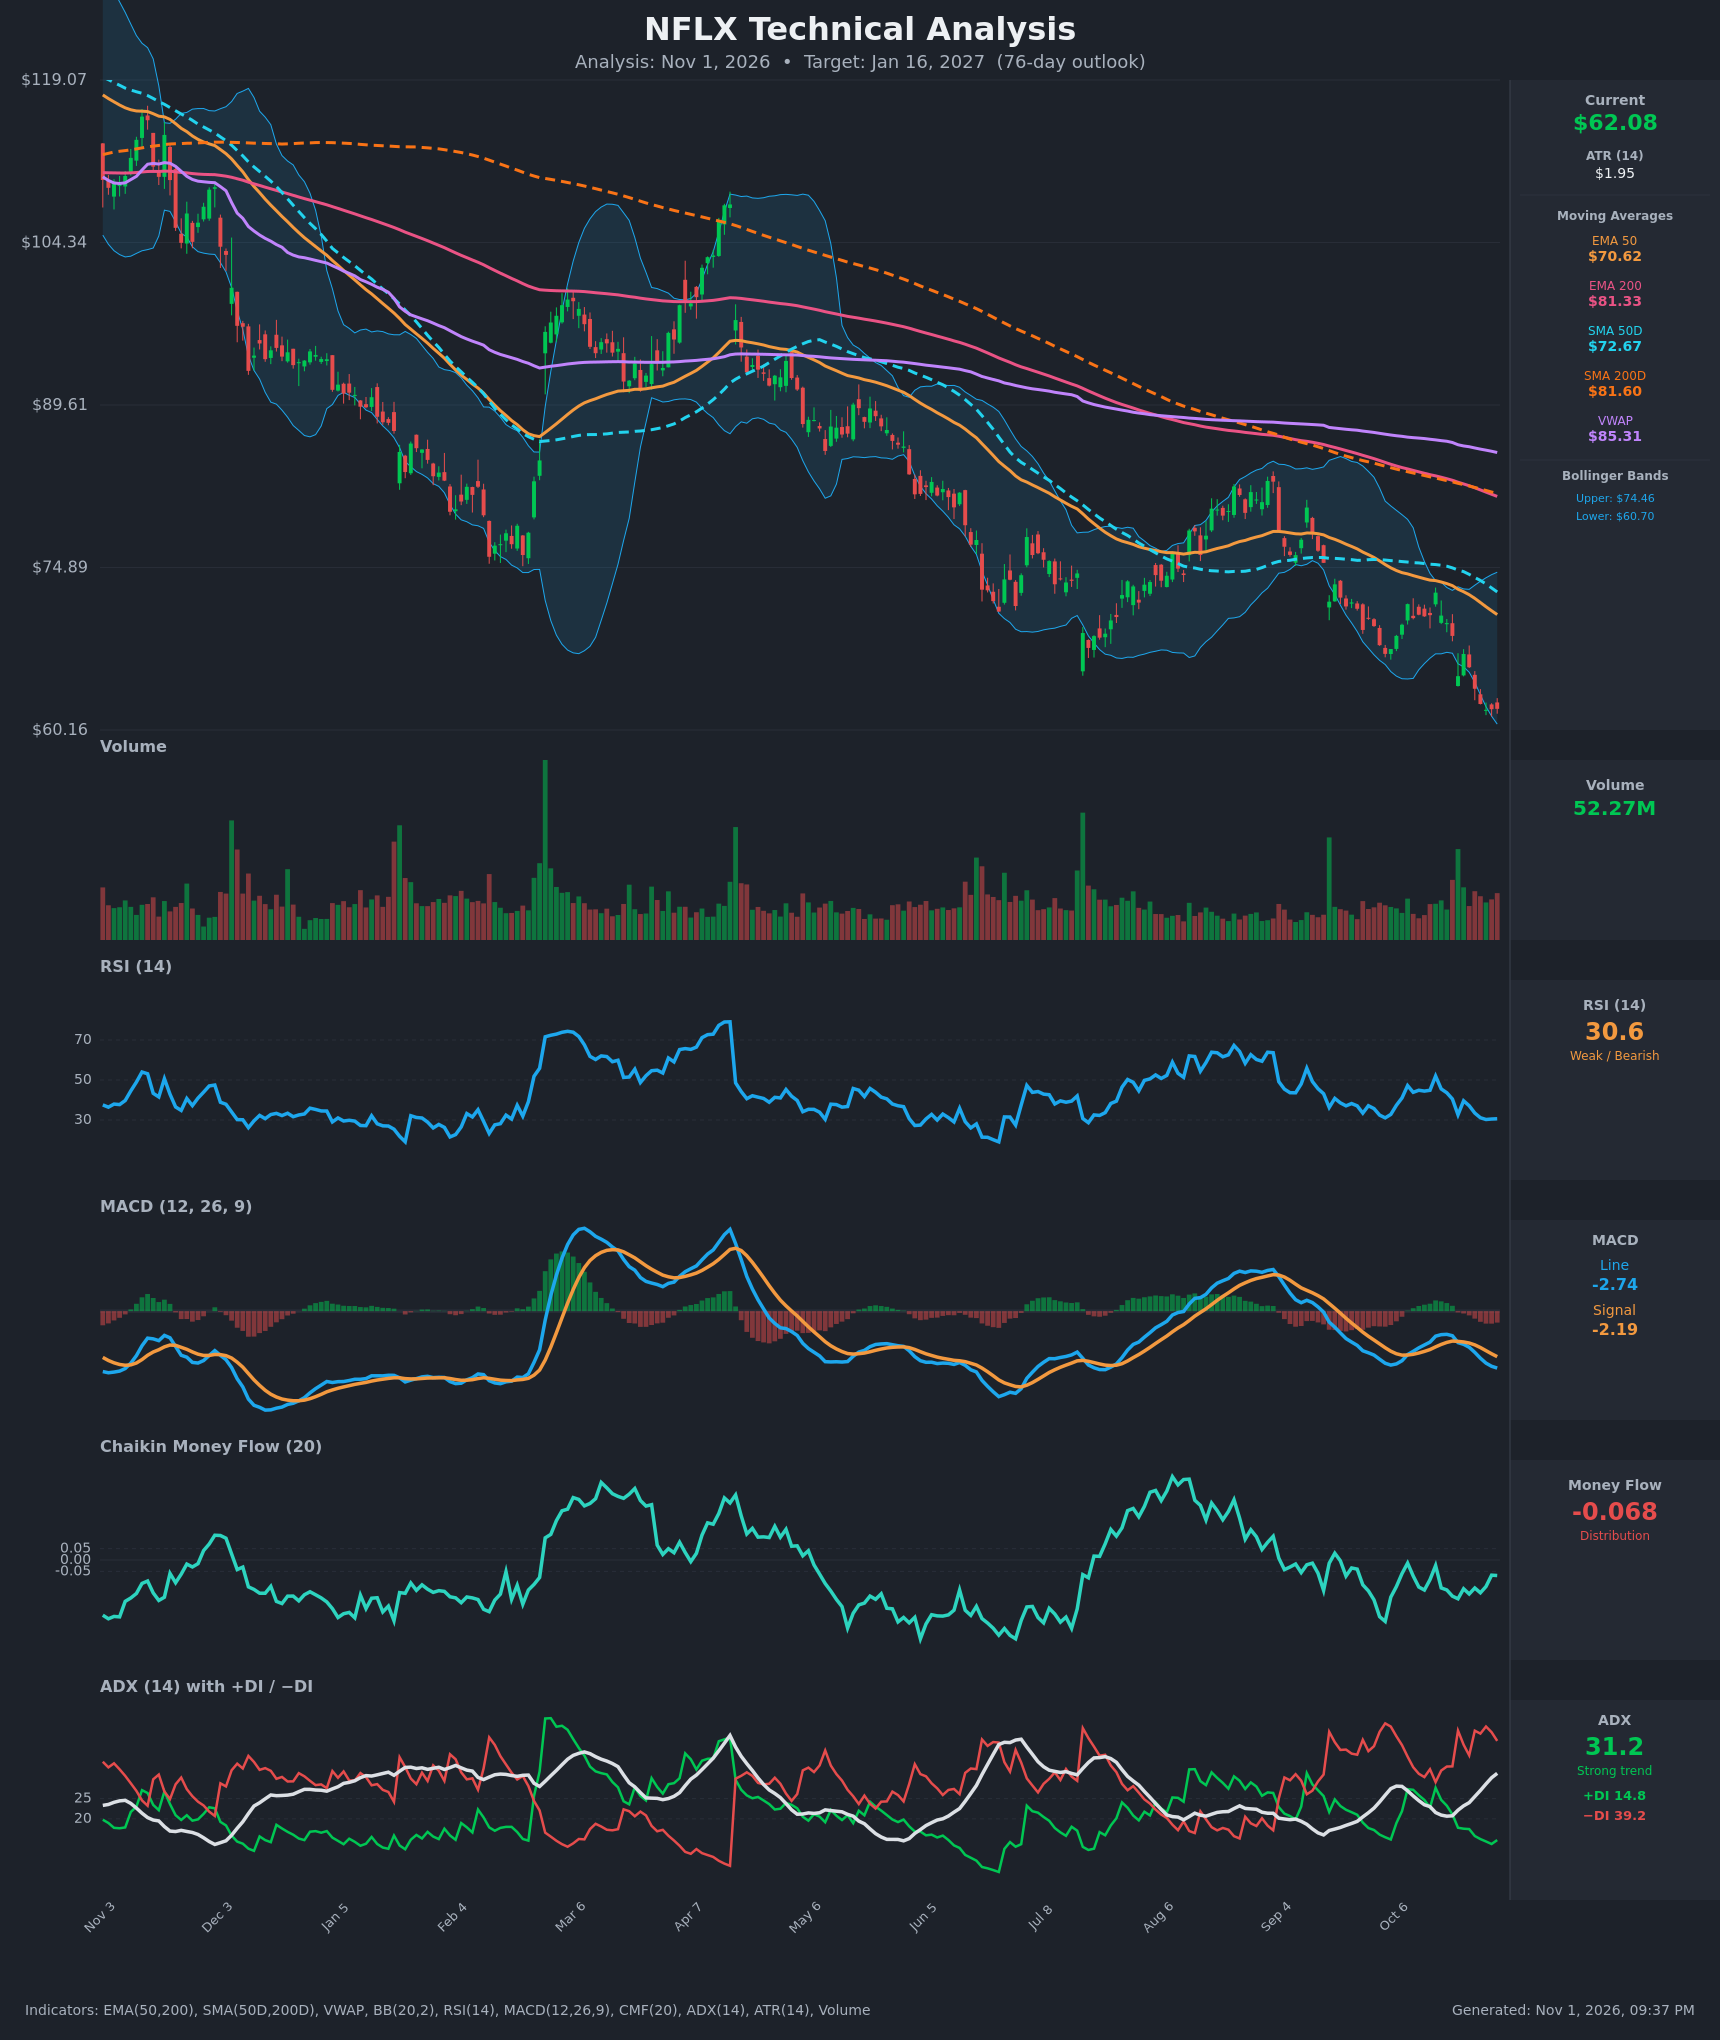
- RSI (14): 30.62, hovering right at the oversold threshold. It has fallen from 52 on Oct 15 and has been flat at 30-31 for the last 4 sessions. Momentum is weak but selling is starting to stall. [Bearish]
- 20 EMA: Not supplied. The EMA 50 at $70.62 is the nearest proxy. Price at $62.08 sits about 12% below it, and the EMA 50 is falling steadily (from $74.01 to $70.62 in 15 bars), so it acts as overhead resistance. [Bearish]
- MACD: Line -2.738 is below signal -2.189, and the gap is widening (histogram about -0.55 and getting more negative). The bearish crossover happened around Oct 21, and there is no sign of a turn. [Bearish]
- Bollinger Bands (20): Upper $74.46, lower $60.70. Price at $62.08 is in the lower band, near the lower edge. It has been riding the lower band, which is typical of a strong downtrend, though it also leaves the stock stretched for a short-term bounce. [Bearish]
- CMF (20): -0.068, below the -0.05 threshold. It has been negative throughout the decline, with a brief improvement to -0.024 on Oct 15 that faded, so distribution is persistent but mild. [Distribution]
- ADX (14): 31.2 and rising (from 20.7 on Oct 19), with -DI 39.2 well above +DI 14.8. This is a strong, accelerating downtrend with bears firmly in control. [Strong Trend – Bearish]
- Volume: 52.27M, elevated relative to the recent average, with large red-volume bars during the Oct breakdown. There is no capitulation spike yet, so the selloff has not shown exhaustion. [Bearish – selling pressure confirmed]
DIVERGENCES & TRENDS
- Moving average structure: Price ($62.08) < EMA 50 ($70.62) < SMA 50D ($72.67) < EMA 200 ($81.33) < SMA 200D ($81.60) < VWAP ($85.31). This is a fully bearish stack, and every average is sloping down. The SMA 50D death cross (SMA 50D below SMA 200D) has been in force for months, and the gap is widening.
- RSI: No bullish divergence. RSI has held roughly at 30 while price made lower lows (from $65 to $62), which shows slowing momentum but is not a true higher low. Earlier in the year RSI spent long stretches pinned at 25-35 without a durable bounce, which shows oversold readings can persist in this trend.
- MACD: Made a lower low and is accelerating downward, which confirms the price move rather than diverging from it.
- Trend: The chart shows a year-long series of lower highs and lower lows from about $119 to $62. The Aug rally stalled at the SMA 200D/EMA 200 area and reversed, which confirms the long-term averages as resistance. Price is now at a 52-week low area ($60.16 axis low).
- ADX/DI: -DI has been above +DI since early Sep, and the ADX turning up from below 20 shows the trend re-accelerating.
CHART PATTERNS
- Descending channel / Bearish Rising Wedge failure: The Jul–Aug rally formed a rising-wedge-like structure that broke down in Sep, and the subsequent drop is in line with the measured move of that pattern.
- Larger structure: Consecutive lower highs ($119 → ~$108 → ~$85) with lower lows resemble a long-term descending trend rather than a base. There is no valid reversal pattern (such as a double bottom or inverted head and shoulders) yet.
- Possible bullish setup (low probability): A Bullish Falling Wedge or Double Bottom could form if price stabilizes near $60-62, but no confirmation exists today.
- Target implications: The breakdown below the Jul–Aug low (~$65-66) opens room toward the mid-$50s. The bounce target for any relief rally is the $70-72 zone (EMA 50 / SMA 50D).
POTENTIAL SCENARIOS
- Scenario 1: Bearish Trend Continuation — Price remains below all moving averages, with the ADX above 30 and -DI dominant. Rallies fail at the falling EMA 50 and the stock grinds lower, with volume confirming. Trigger: close below $60.16 (the lower band/52-week low area) or failure of any bounce at $66-68. Target: $54-57. Invalidation: daily close above $70.60 (EMA 50) with MACD bullish crossover. (50% probability)
- Scenario 2: Neutral/Bullish Oversold Bounce Then Fade — RSI at 30 and price on the lower band trigger a relief rally toward the middle of the Bollinger range and EMA 50, then price fades and ends near the current level. Trigger: RSI turning up above 35 with a bullish candle on above-average volume. Target: $68-71 on the bounce, ending around $60-65. Invalidation: new low below $58 on heavy volume. (30% probability)
- Scenario 3: Bullish Reversal — Selling exhaustion and a capitulation volume spike mark a bottom, and price reclaims the EMA 50 and SMA 50D. Trigger: close above $72.70 with CMF turning above +0.05. Target: $76-80. Invalidation: close below $60. (20% probability)
PRICE TARGETS
For the 76-day horizon (about Jan 16, 2027), the range width should be roughly 18-30% of the current price.
- Target Price: $58.50 (the trend is strongly bearish, but oversold conditions and the potential for bounces limit the downside)
- Expected Range: $50.50 to $69.00 (width $18.50, about 29.8% of $62.08, consistent with the 61-180 day guidance)
- Key Levels: Support at $60.16, Resistance at $70.62
OVERALL BIAS
OVERALL BIAS: BEARISH - Price sits below a fully bearish moving-average stack with a death cross, ADX at 31 and rising with -DI far above +DI, a widening MACD bearish gap, and persistent CMF distribution. The oversold RSI argues for bounces, but there is no reversal confirmation, so the path of least resistance remains lower.
This is educational analysis and not financial advice.