NBIS 76-day bearish forecast — Nov 1, 2026
- Bias: Bearish
- Timeframe: 76 days (made Nov 1, 2026, target date Jan 15, 2027)
- Price at analysis: $154.14
- Price target: $138.00
- Expected range: $118.00 – $162.00
- Result: Pending — graded after the close on Jan 15, 2027
Get a free AI analysis of NBIS today
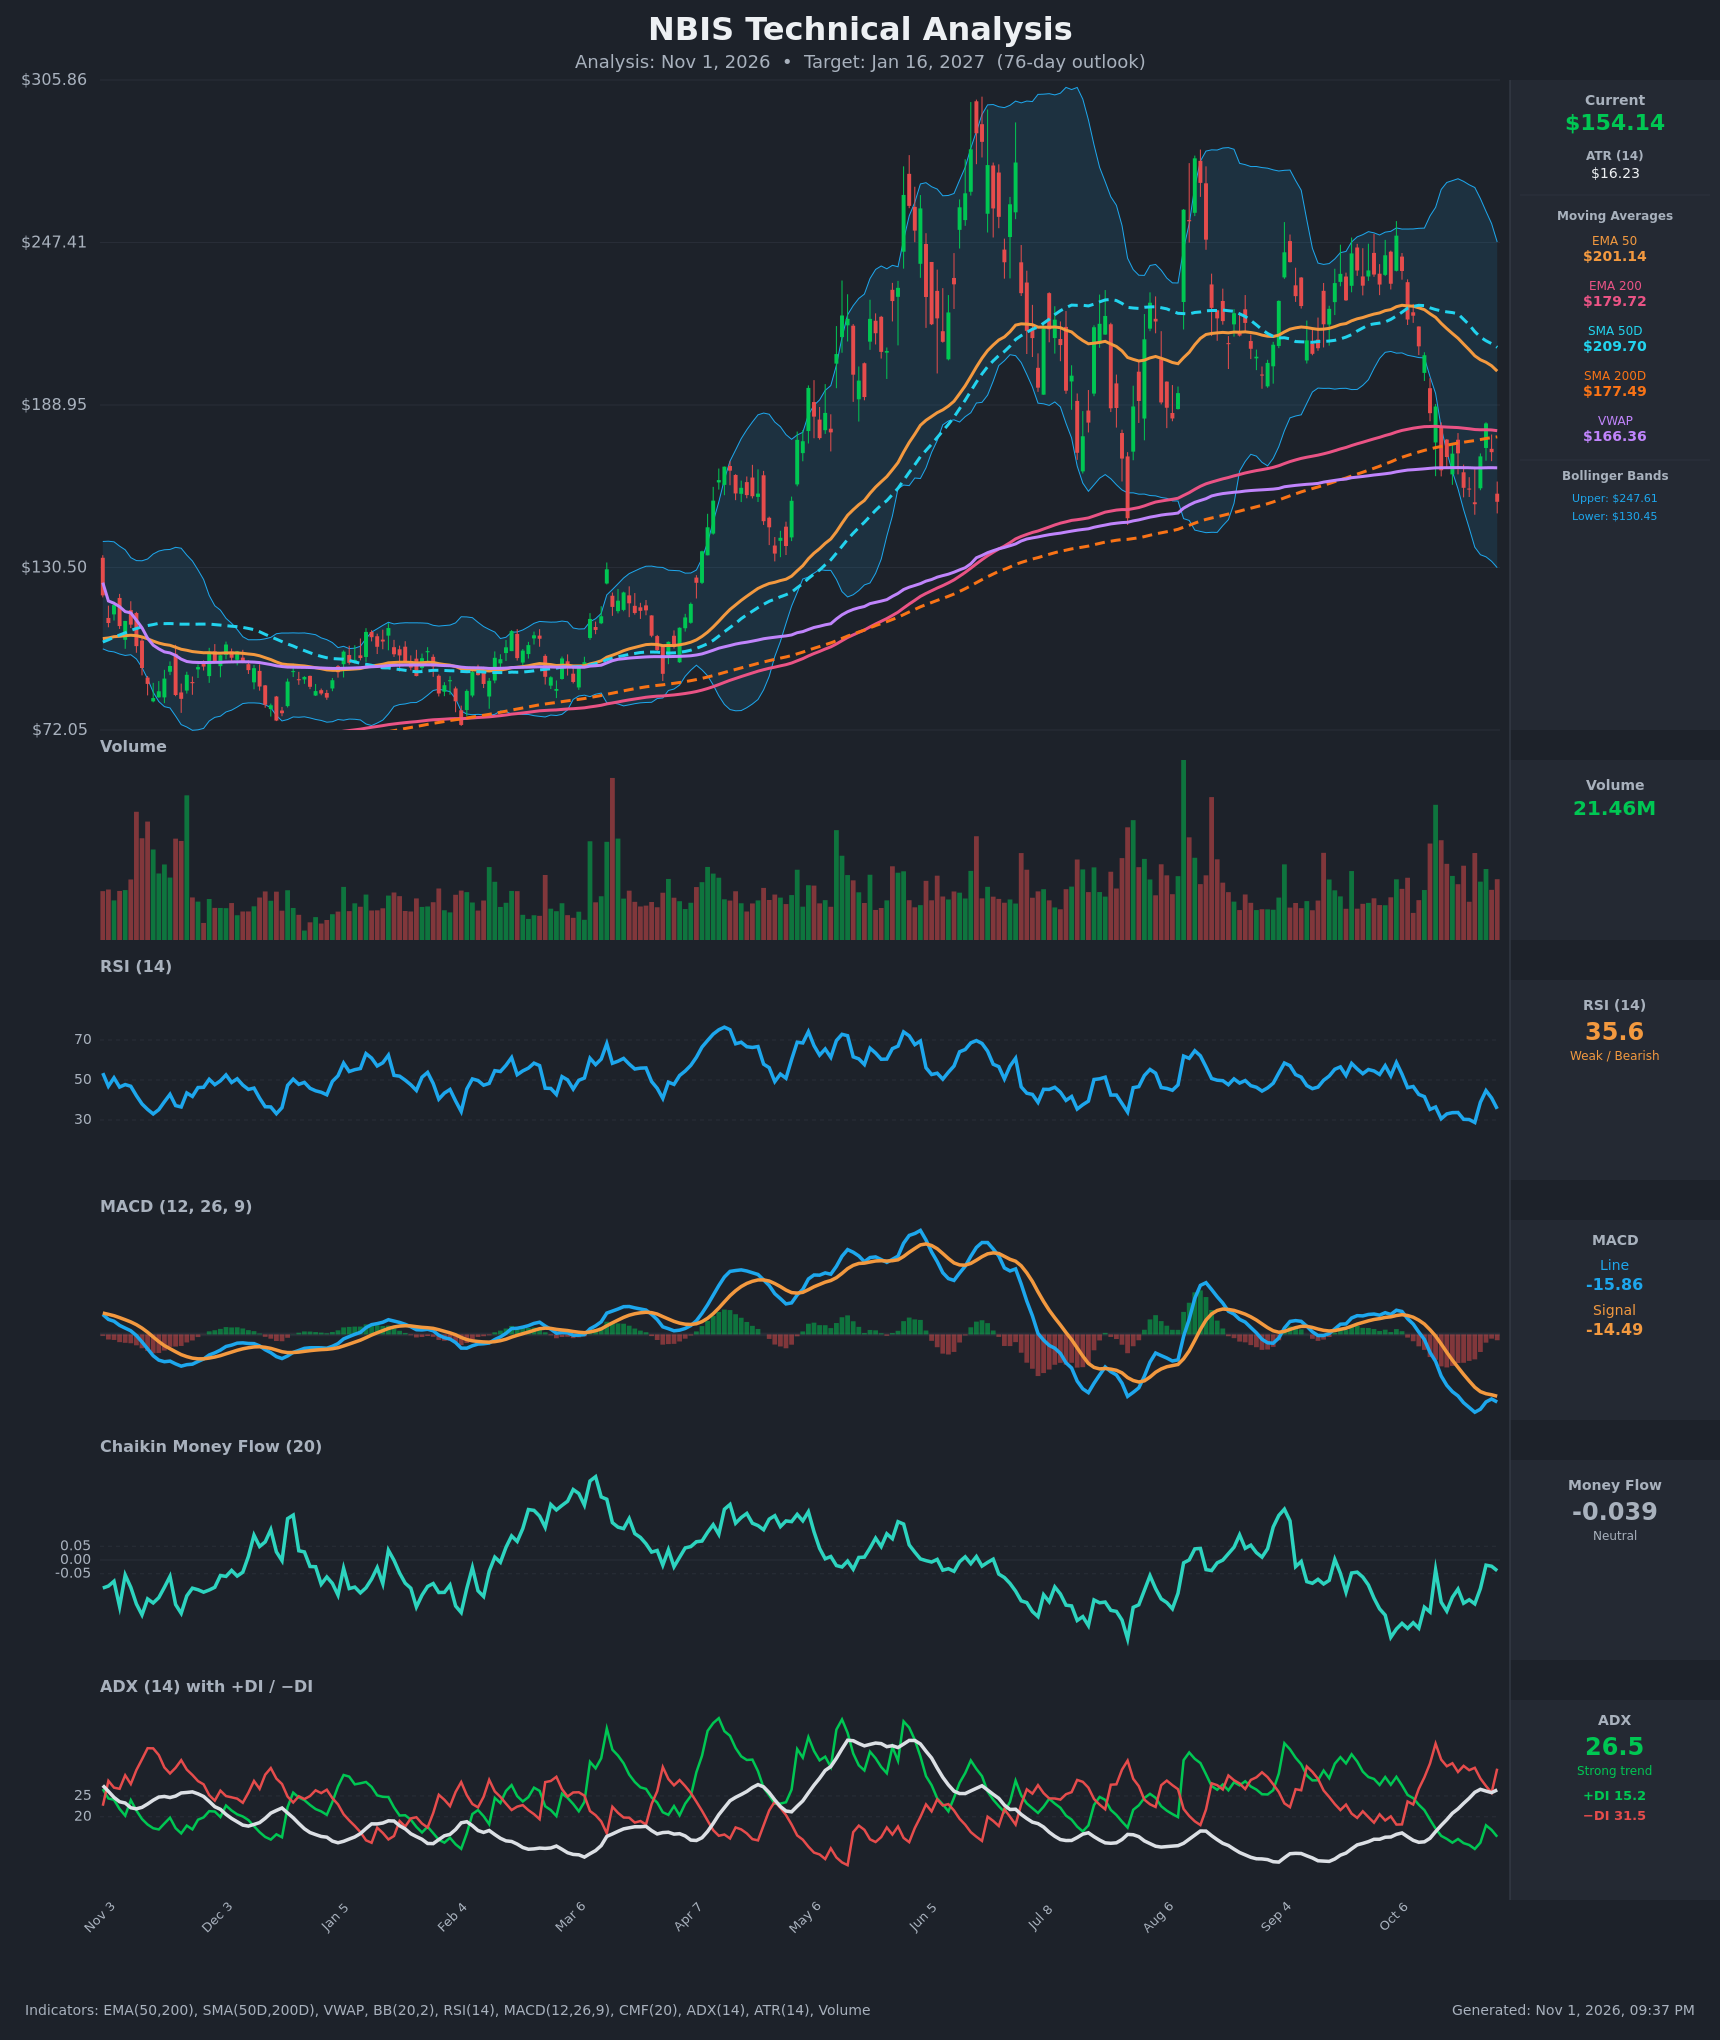
Analysis
TECHNICAL INDICATORS
- RSI (14): 35.58, in the weak zone but not oversold. It bounced from 28.8 (Oct 26) to 44.7 (Oct 28), then rolled over again to 35.6. Lower highs in momentum show sellers regaining control. [Bearish]
- 20 EMA: The 20 EMA is not supplied. The 50 EMA ($201.14) is falling and sits about 30% above price, and the 200 EMA ($179.72) is also overhead. Price is below both, and both now act as resistance. [Bearish]
- MACD: Line -15.86 is below signal -14.49, a bearish crossover that has widened again after the Oct 27-28 attempt to converge. The histogram is negative and re-expanding, and both lines are deeply negative. [Bearish]
- Bollinger Bands (20): Upper $247.61, lower $130.45, with a very wide band width after the high volatility. Price at $154.14 is in the lower third, about $24 above the lower band. The bands are rolling over and there is room to run toward the lower band before it is tested. [Bearish]
- CMF (20): -0.039, inside the neutral zone, though it has been negative throughout the decline (-0.10 to -0.25). Buying has not shown up on the bounce, and there is no accumulation. [Neutral]
- ADX (14): 26.5 and rising from about 14 two weeks ago, so a strong trend is forming. −DI (31.5) is well above +DI (15.2), so bears are firmly in control. [Strong Trend – Bearish]
- Volume: 21.46M, with large spikes on the red candles of Oct 14-16 and again on this drop. Volume expanding on declines and fading on bounces points to distribution. [Bearish]
Moving average context:
- SMA 200D / EMA 200: Price is below the SMA200D ($177.49) and the EMA200 ($179.72).
- VWAP: Price is below VWAP ($166.36), which is the first overhead resistance.
- Crossovers: The 50-day averages ($201–$210) are still above the 200s, so no death cross has formed. They are converging quickly, and a death cross is plausible within the 76-day window.
DIVERGENCES & TRENDS
- There is no bullish divergence. RSI made a low of 28.8 at the Oct 26 price low of $153.27, and RSI is now 35.6 with price back at $154.14. That is a failed bounce rather than a divergence.
- MACD is making new lows (-18.2 then -15.9) in line with price, so momentum confirms the downtrend.
- ADX is climbing through 25 with −DI dominant, which is a strong-trend confirmation and a trend-continuation signal.
- Price lost the 50 EMA and 50 SMA in mid-October with a gap down, then lost the 200s. The Oct 28 rally to $182 was rejected right at the 200-day cluster (about $177–$180), which confirms it as resistance.
- The MACD bearish crossover (Oct 12-15) has persisted for about three weeks with no recovery.
- The major swing high is near $300 (June). The rally in September/October produced a lower high near $245, and price has since broken the late-summer support area.
CHART PATTERNS
- The structure fits a Bearish Head and Shoulders / lower-high reversal loosely. The June peak (about $300) is the head, the Aug and Oct highs are lower shoulders, and the neckline is in the $150–$160 area. Price is sitting on that neckline now.
- A clean close below roughly $150 would confirm the pattern. The measured move (head near $300 to neckline near $155, about $145) would be very large, but realistic targets are the $130 lower Bollinger Band and the $115–$120 zone. In the chart, the earlier base sits near $95–$105.
- The Oct 27-28 bounce looks like a dead-cat retest of the broken 200-day averages (similar to a bearish pennant/flag after the sharp drop).
- Failure case: a reclaim of $177–$180 (the 200-day cluster) would invalidate the pattern and open a bullish retest of the $200 area.
POTENTIAL SCENARIOS
- Scenario 1: Bearish Neckline Break and Continuation — Price loses the $150–$153 support (Oct 26 low) and trend momentum (ADX above 25, −DI dominant, MACD negative) carries it toward the lower Bollinger Band, possibly with a death cross forming. Trigger: daily close below $150 on above-average volume. Target: $130 first, then $118–$120 by mid-January. Invalidation: daily close above $177.50 (SMA200D). (52% probability)
- Scenario 2: Bullish Relief Rally / Base Retest — Price holds the $150 area, RSI stays above 30 and rebounds, and the stock mean-reverts toward VWAP and the 200-day averages. This is a bounce inside the downtrend. Trigger: close above $166.36 (VWAP) with CMF turning positive. Target: $177–$182, with an extension to $200 only if the 200-day cluster breaks. Invalidation: close below $148. (33% probability)
- Scenario 3: Neutral Chop Between $130 and $178 — Price consolidates between the lower Bollinger Band and the 200-day cluster as ADX cools. Trigger: failed breakouts on both sides with falling volume. Target: $150–$165. Invalidation: a daily close outside $128–$180. (15% probability)
PRICE TARGETS
- Target Price: $138.00 (76-day, below the $154.14 current price, consistent with a partial downside continuation toward the lower Bollinger Band at $130.45)
- Expected Range: $118.00 to $162.00 (width $44, about 28.5% of current price, within the 18-30% guidance for a 61-180 day horizon; it is slightly skewed lower to reflect the bearish tilt)
- Key Levels: Support at $130.45 (lower Bollinger Band; the $150 neckline is the first line to break), Resistance at $166.36 (VWAP, then the $177.49 SMA200D)
OVERALL BIAS
OVERALL BIAS: BEARISH - Price is below every major moving average and VWAP, MACD is in a bearish crossover and widening, and ADX of 26.5 with −DI at 31.5 versus +DI at 15.2 confirms a strong downtrend. The Oct 28 bounce failed at the 200-day cluster, and price now sits on neckline-type support, so a break points toward $130 and below.
This is educational analysis and not financial advice.