NOK 76-day bearish forecast — Nov 1, 2026
- Bias: Bearish
- Timeframe: 76 days (made Nov 1, 2026, target date Jan 15, 2027)
- Price at analysis: $8.56
- Price target: $8.10
- Expected range: $7.10 – $9.00
- Result: Pending — graded after the close on Jan 15, 2027
Get a free AI analysis of NOK today
Analysis
TECHNICAL INDICATORS
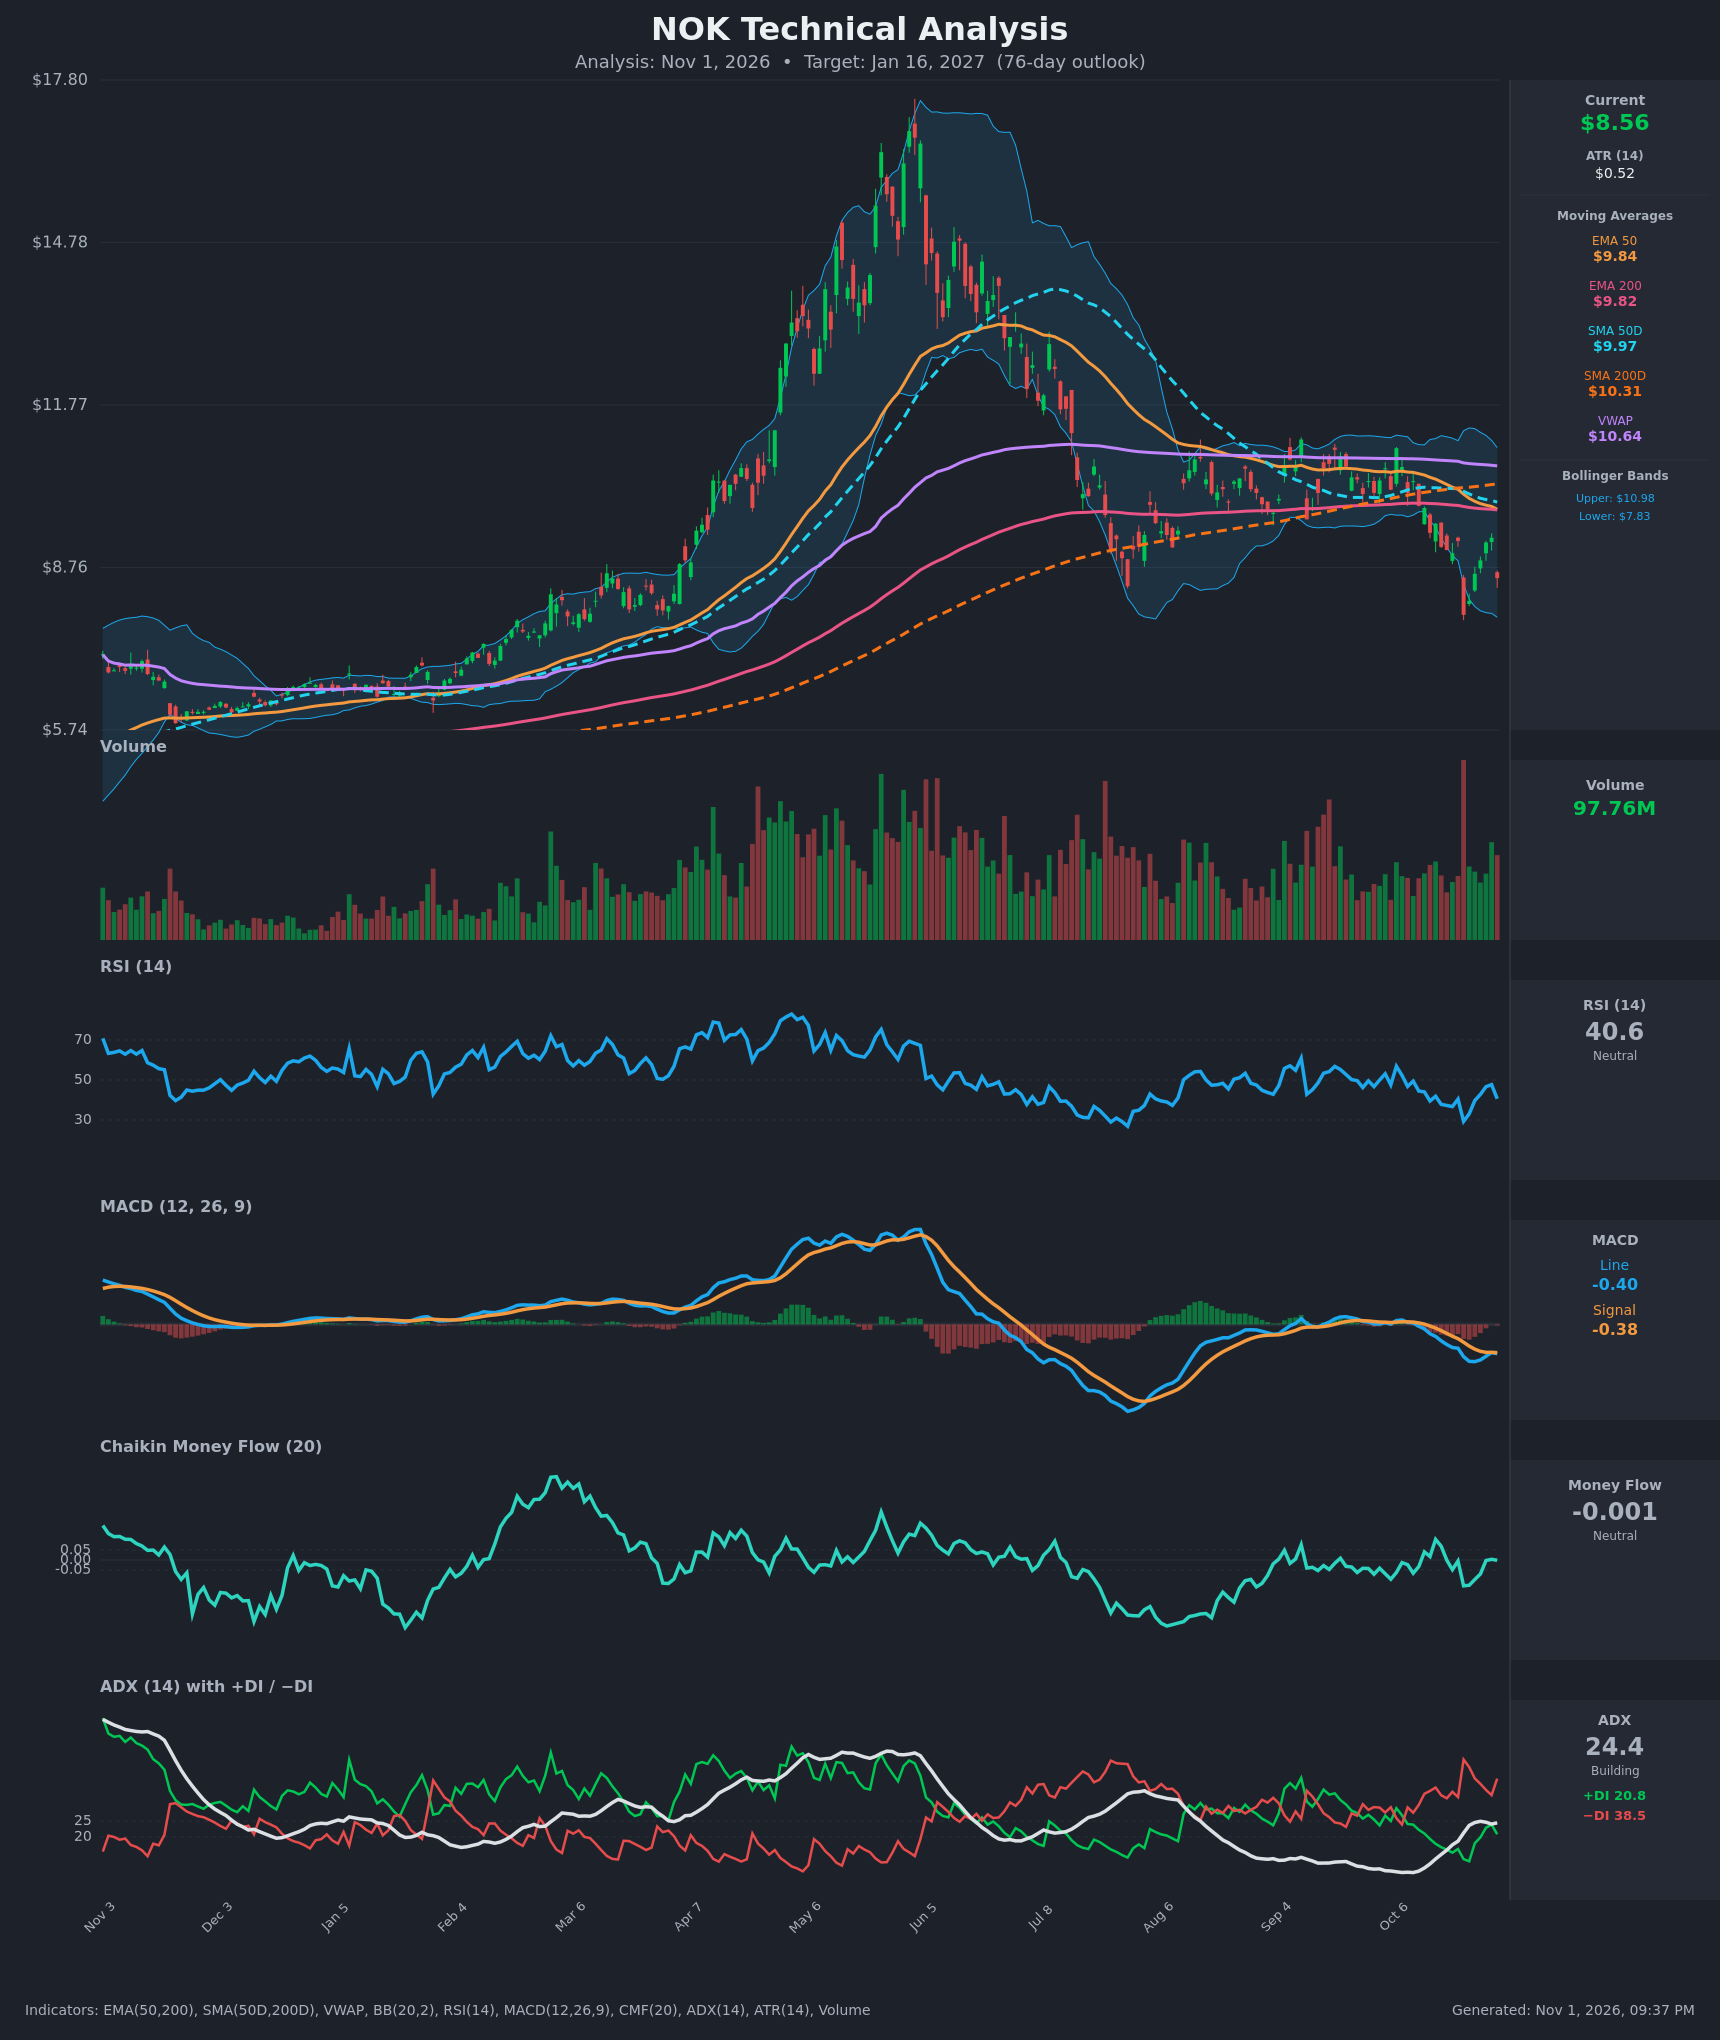
- RSI (14): 40.61, down from 47.7 two sessions ago after the sharp Oct 30 drop. It sits below the 50 midline but is not oversold (the Oct 22 low read 29.3). The pattern since August is lower highs, so momentum favors sellers. [Bearish]
- 20 EMA: Not supplied. The 50 EMA ($9.84) and 200 EMA ($9.82) are used instead. Price at $8.56 is about 13% below both, and the two are converging as the 50 EMA rolls over (it was $10.50 on Oct 12). A bearish EMA cross is imminent, and the cluster now acts as overhead resistance. [Bearish]
- MACD: Line -0.395 is below signal -0.381, a fresh bearish re-cross after a brief convergence on Oct 29. Both lines are negative and the histogram is slightly negative. This is a mild but consistent loss of momentum. [Bearish]
- Bollinger Bands (20): Upper $10.98, lower $7.84, mid-band about $9.41. Price at $8.56 is in the lower half, about 23% of the band width above the lower band. The Oct 22 plunge touched the lower band and the bounce failed at the mid-band. The bands are wide, so volatility is elevated and the lower band is the next target. [Bearish]
- CMF (20): -0.001, inside the ±0.05 neutral zone. It has hovered near zero since mid-October with no accumulation on the bounce. Buyers are not stepping in, but heavy distribution is not confirmed either. [Neutral]
- ADX (14): 24.4, rising from the ~9 reading on Oct 12 and just under the 25 threshold. −DI at 38.5 is far above +DI at 20.8, so bears control a trend that is building. [Strong Trend - Bearish]
- Volume: 97.76M on the latest bar, elevated versus the recent average and in line with the selling bars of the past two weeks. The Oct 22 breakdown came on a volume spike, and the Oct 30 red candle on solid volume confirms selling pressure. [Bearish - selling on volume]
DIVERGENCES & TRENDS
- No meaningful divergence. RSI, MACD and price are all making lower highs after the bounce. Price made a lower low than the Oct 22 bounce high, and RSI at 40.6 is below the 47.7 peak.
- Moving average structure: SMA50D ($9.97) is below SMA200D ($10.31), so the death cross is already in place. Price is below SMA200D, which signals a long-term downtrend. The 50 EMA is about to cross below the 200 EMA ($9.84 vs $9.82).
- VWAP: Price is far below VWAP ($10.64), so sellers have the edge.
- DI and ADX: −DI has stayed above +DI for the entire 15-bar window. ADX has climbed from 9 to 24, so the trend is accelerating, not fading.
- Oct 22 gap: The drop from $9.25 to $7.88 was fully retraced to $9.31, then rejected sharply on Oct 30 (-8%). This looks like a failed recovery and a retest of broken support.
CHART PATTERNS
- Bearish range breakdown (descending-triangle / expanding-triangle family): From August to October, price consolidated at roughly $9.0-$10.5 under falling resistance. It then broke down below the $9.00 floor, matching the descending-triangle breakdown in the reference diagram. The measured move of the ~$1.50 range height from $9.00 points to about $7.50.
- Bearish flag / pennant (weak): The Oct 22-Oct 29 bounce from $7.88 to $9.31, then a sharp rejection, resembles a failed bounce within a downtrend. A break below $7.88 would confirm continuation.
- Larger context: The June peak near $17.50 and the long decline since form a large distribution top. The older base around $6-$7 is the longer-term support zone.
POTENTIAL SCENARIOS
- Scenario 1: Bearish Continuation Lower — The failed bounce and bearish DI/ADX structure lead to a grind lower. The 50 EMA crosses below the 200 EMA and price retests the Oct 22 low and the lower Bollinger Band. Trigger: daily close below $8.14, then below $7.88. Target: $7.50 initially, with an extension to about $7.10. Invalidation: daily close above $9.35, which reclaims the Oct 29 high and the mid-band. (50% probability)
- Scenario 2: Neutral Choppy Base — Price holds the $7.88 low and ranges between $7.90 and $9.30 as selling exhausts and RSI stays 35-50. Trigger: repeated defenses of $7.88 with falling volume. Target: $8.30-$8.80 around the current level. Invalidation: close below $7.80 or above $9.35. (28% probability)
- Scenario 3: Bullish Relief Recovery — A sharp rebound off the Oct 22 low zone reclaims the 50 and 200 EMAs. Trigger: close above $9.31, then above $9.84. Target: $9.85-$10.30, the EMA cluster and SMA200D. Invalidation: rejection at $9.30 and a close back below $8.50. (22% probability)
PRICE TARGETS
For the 76-day horizon (about Jan 16, 2027), I expect a modest drift lower with elevated volatility. The ATR of $0.52 and the wide Bollinger Bands support a broad range.
- Target Price: $8.10
- Expected Range: $7.10 to $9.00 (width $1.90, about 22% of the current price, within the 18-30% guidance for 61-180 days)
- Key Levels: Support at $7.84 (lower Bollinger Band, near the $7.88 Oct 22 low), Resistance at $9.31 (Oct 29 high, below the EMA cluster near $9.83)
OVERALL BIAS
OVERALL BIAS: BEARISH - Price is below all key moving averages with a confirmed death cross and a pending bearish 50/200 EMA cross. −DI (38.5) dominates +DI (20.8) with ADX rising toward 25, MACD is below its signal, and the post-gap bounce failed at the $9.31 high. CMF is neutral and the downside is partly buffered by the $7.84-$7.88 support, so conviction is moderate.
This is educational analysis and not financial advice.