ORCL 76-day bearish forecast — Nov 1, 2026
- Bias: Bearish
- Timeframe: 76 days (made Nov 1, 2026, target date Jan 15, 2027)
- Price at analysis: $130.67
- Price target: $122.00
- Expected range: $108.00 – $138.00
- Result: Pending — graded after the close on Jan 15, 2027
Get a free AI analysis of ORCL today
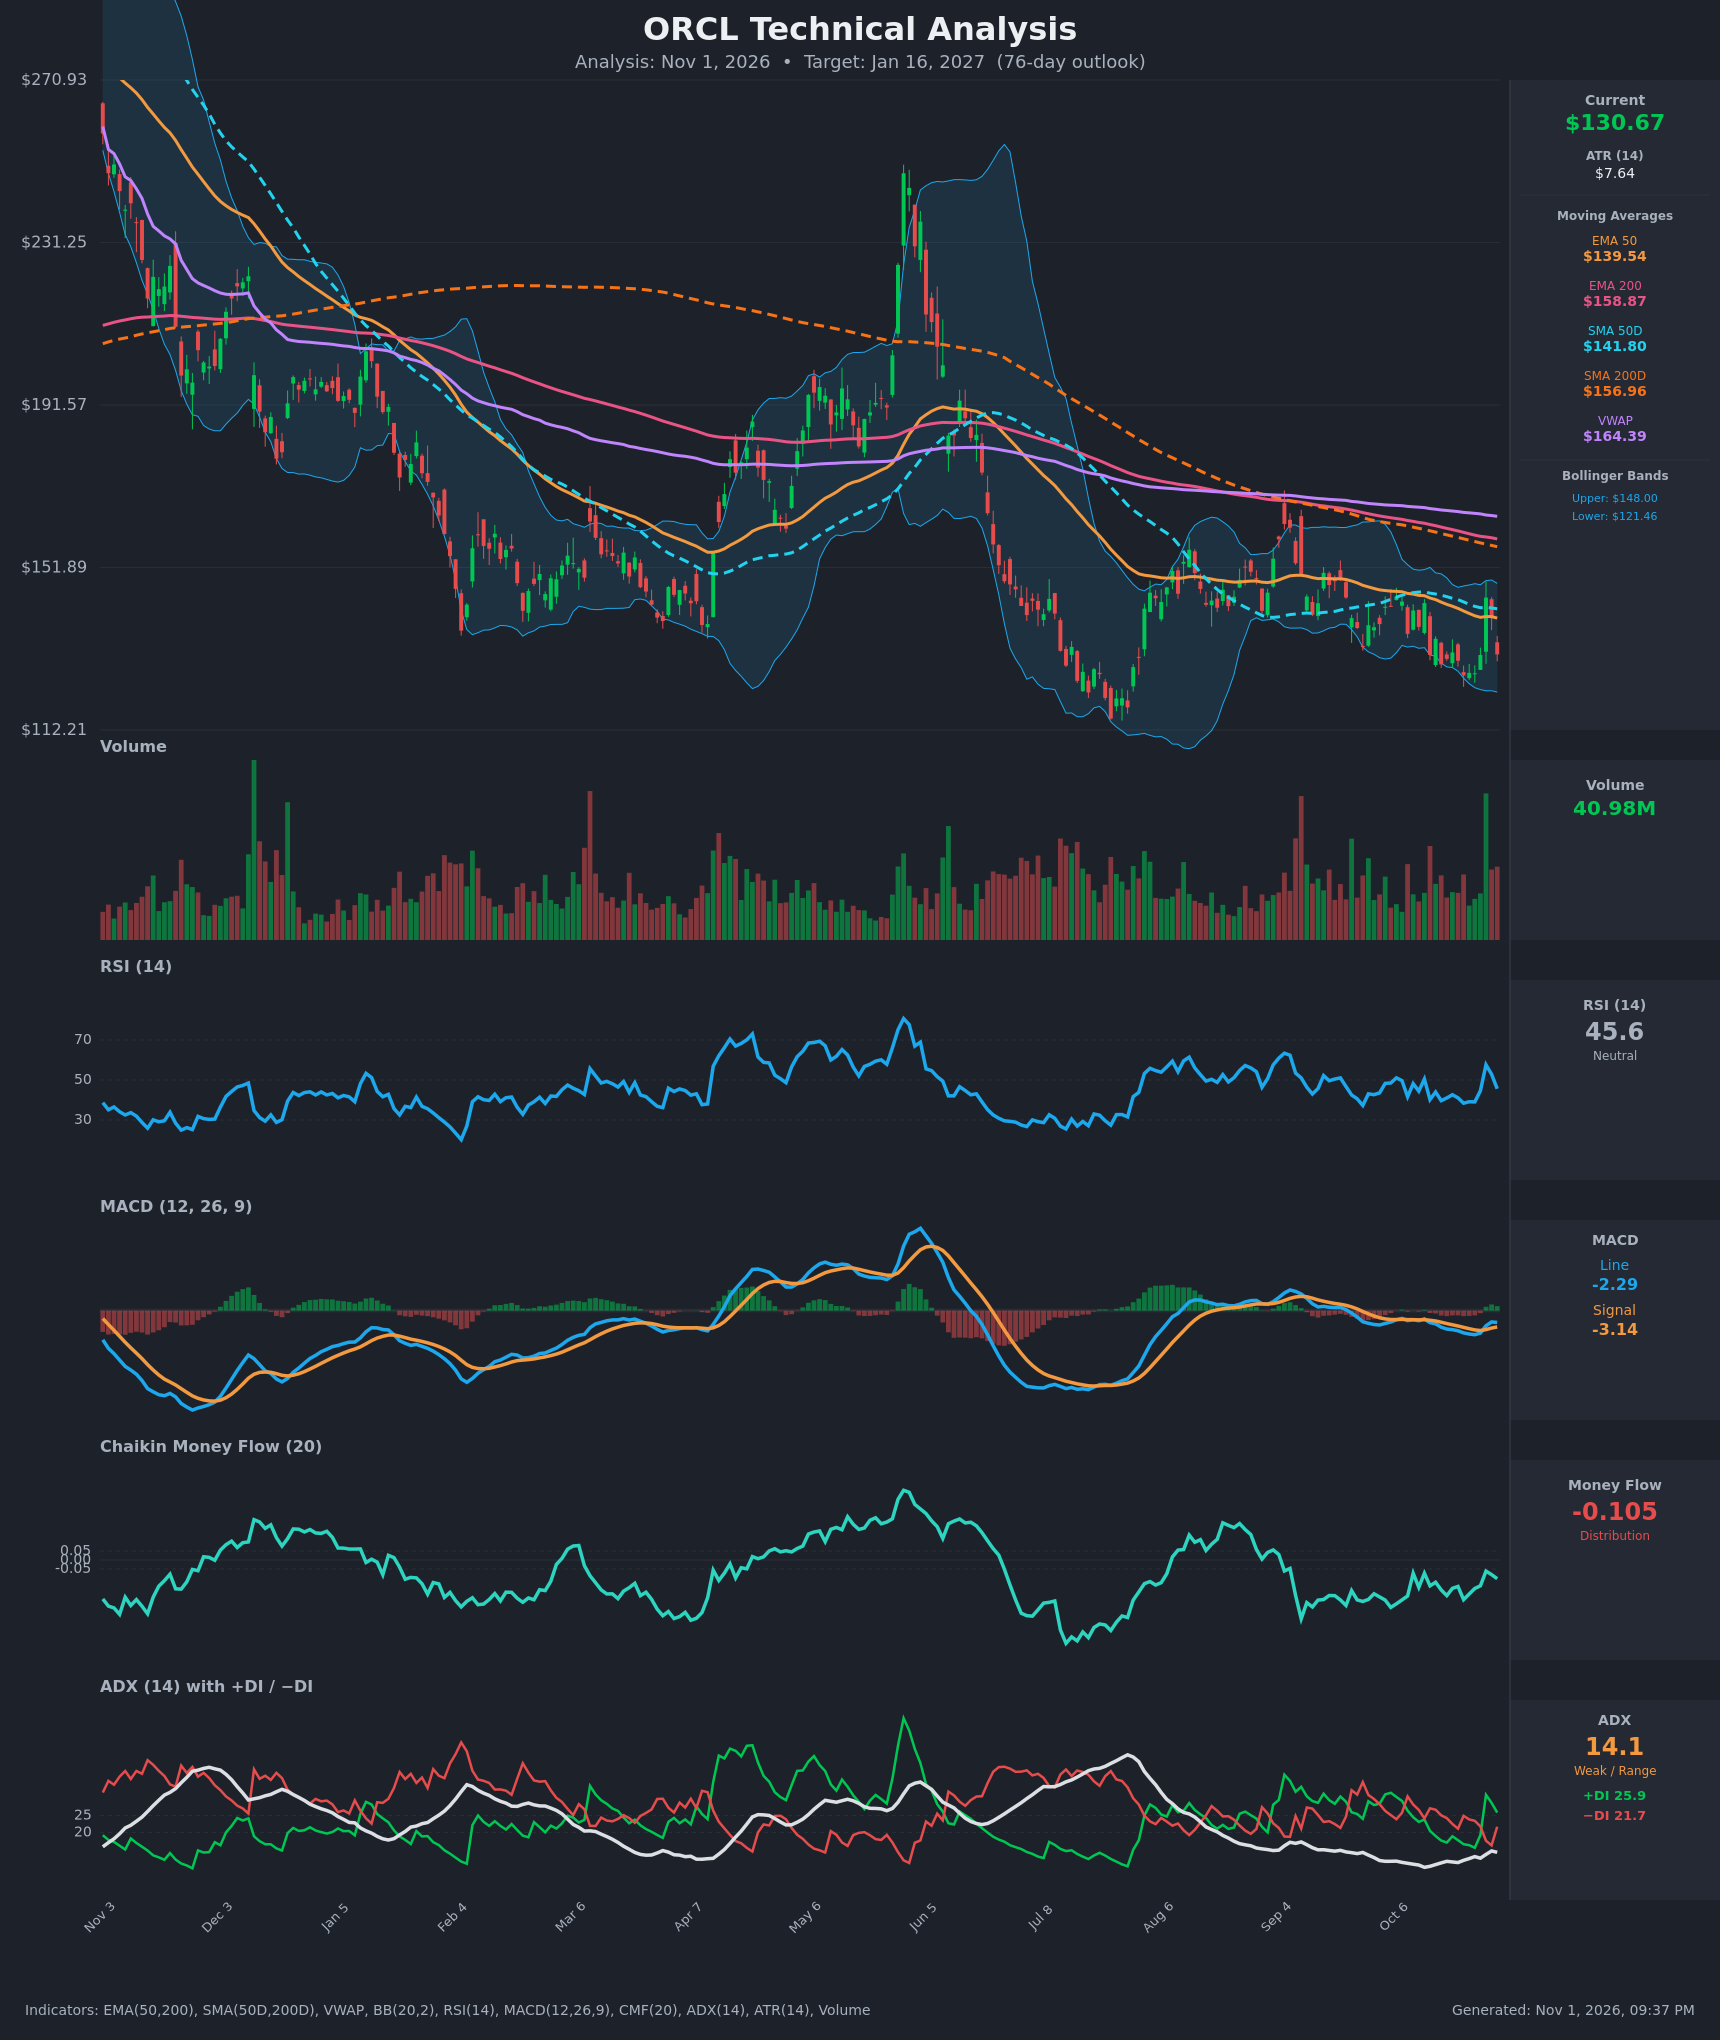
Analysis
TECHNICAL INDICATORS
- RSI (14): 45.62, just under the 50 midline. It spiked to 57.6 on the Oct 28 bounce and has since rolled back down. It is neither oversold nor overbought, and momentum is fading. [Neutral]
- 20 EMA: The 20 EMA is not provided. Using the EMA 50 as the nearest guide, it sits at $139.54 and price at $130.67 is about 6% below it. The EMA 50 has fallen steadily from $145 and is acting as resistance, and the Oct 28 spike failed to hold above it. [Bearish]
- MACD: Line -2.29 vs signal -3.14, so the histogram is slightly positive (+0.86). The line crossed above the signal on Oct 28, but both remain well below zero. The bounce was a weak momentum improvement inside a downtrend, and the line is already turning down again (-2.18 to -2.29). [Neutral]
- Bollinger Bands (20): Upper $148.00, lower $121.46, with price at $130.67 in the lower half (about 34% of the band width). The bands are relatively narrow versus earlier in the year, which points to compression. The lower band is about 7% away and has been tested repeatedly in October. [Bearish]
- CMF (20): -0.105, below the -0.05 threshold. It has stayed negative (between -0.06 and -0.22) throughout October, so selling pressure is persistent. [Distribution]
- ADX (14): 14.1 with +DI 25.9 and -DI 21.7. The trend is weak and range-bound. +DI is back above -DI after the Oct 28 spike, but the margin is narrowing quickly (31.2/17.5 to 25.9/21.7) and the ADX is too low to confirm any direction. [Weak Trend, slight bullish DI tilt]
- Volume: 40.98M, with a large green-bar spike on Oct 28 and a selloff on the latest bar that gave back the gain. Volume on the bounce was not sustained, and the bounce is fading. [Mixed, leaning bearish]
DIVERGENCES & TRENDS
- Moving-average structure: Price ($130.67) is below the EMA 50 ($139.54), SMA 50D ($141.80), EMA 200 ($158.87), SMA 200D ($156.96) and VWAP ($164.39). The EMA 50 is below the EMA 200 and the SMA 50D is below the SMA 200D. The death cross is well established, and the long-term trend is down from about $270.
- MACD: The Oct 28 bullish crossover happened below zero, which is low-reliability. The MACD line has already started to roll over.
- Price vs RSI: Price made lower lows on Oct 22–26 (~$125.5) while RSI printed ~38–39. No clear bullish divergence is visible. The RSI range of 38–58 since August confirms sideways-to-down drift.
- CMF: It has stayed under zero since late September with no sign of accumulation, which confirms the weak price structure.
- ADX: At 14.1 it is near its yearly lows. Trend strength is low, so a volatility expansion (breakout in either direction) becomes more likely over the coming weeks.
- Bollinger squeeze: The bands have tightened from the very wide June–July levels.
CHART PATTERNS
- Primary: Descending Triangle (bearish continuation) / Bearish Pennant-style consolidation. Since August, price has made lower highs (about $155 to $145 to $144) against support near $125–126 (the Oct 22–26 lows). This sits inside a larger downtrend from $270, so continuation lower is the base case. A break below ~$125 would give a measured move of roughly the pattern height (~$22–25), pointing toward ~$100–103. That is an extension target and not my base case within 76 days.
- Secondary: Possible Bullish Falling Wedge or Double Bottom. The Oct 22/26 lows near $125.5 could form a base, and the bounce to $144.54 shows buyers exist. It has not been confirmed. It would need a close above $144–148 (the EMA 50, SMA 50D and upper Bollinger Band cluster).
- The pattern evidence slightly favors the bearish structure, because the highs keep falling and every moving average is stacked overhead.
POTENTIAL SCENARIOS
- Scenario 1: Bearish Descending Triangle Breakdown — Price keeps making lower highs under the EMA 50 and breaks the ~$125 floor. Selling pressure (CMF < -0.1) persists and the ADX rises as −DI retakes control. Trigger: daily close below $125.50, then below the lower Bollinger Band at $121.46. Target: $118–$122 within the window, with an extension toward $108 and then ~$100–103. Invalidation: daily close above $141.80 (SMA 50D). (50% probability)
- Scenario 2: Neutral Range Persistence — The ADX stays below 20 and price oscillates between $125 and $144, with the EMA 50 capping rallies. Trigger: failure to close beyond either boundary. Target: $126–$138. Invalidation: close below $124 or above $146. (25% probability)
- Scenario 3: Bullish Base and Recovery — The $125 support holds as a double bottom and a rally follows the Oct 28 impulse. Trigger: close above $141.80, then above $148 with volume and CMF turning positive. Target: $148–$157 (the SMA 200D / EMA 200 zone). Invalidation: close below $125. (25% probability)
PRICE TARGETS
- Target Price: $122.00 (76 days, Jan 16, 2027)
- Expected Range: $108.00 to $138.00 (width $30.00, about 23% of the current price, consistent with the 61–180 day guidance)
- Key Levels: Support at $125.50, Resistance at $139.54
OVERALL BIAS
OVERALL BIAS: BEARISH - Price is below every major moving average with a death cross in place. CMF shows persistent distribution, and the lower highs against ~$125 support form a descending-triangle structure, while the weak ADX (14.1) and the recent MACD crossover cap conviction.
This is educational analysis and not financial advice.