NVDA 76-day bearish forecast — Nov 1, 2026
- Bias: Bearish
- Timeframe: 76 days (made Nov 1, 2026, target date Jan 15, 2027)
- Price at analysis: $204.64
- Price target: $196.00
- Expected range: $176.00 – $230.00
- Result: Pending — graded after the close on Jan 15, 2027
Get a free AI analysis of NVDA today
Analysis
TECHNICAL INDICATORS
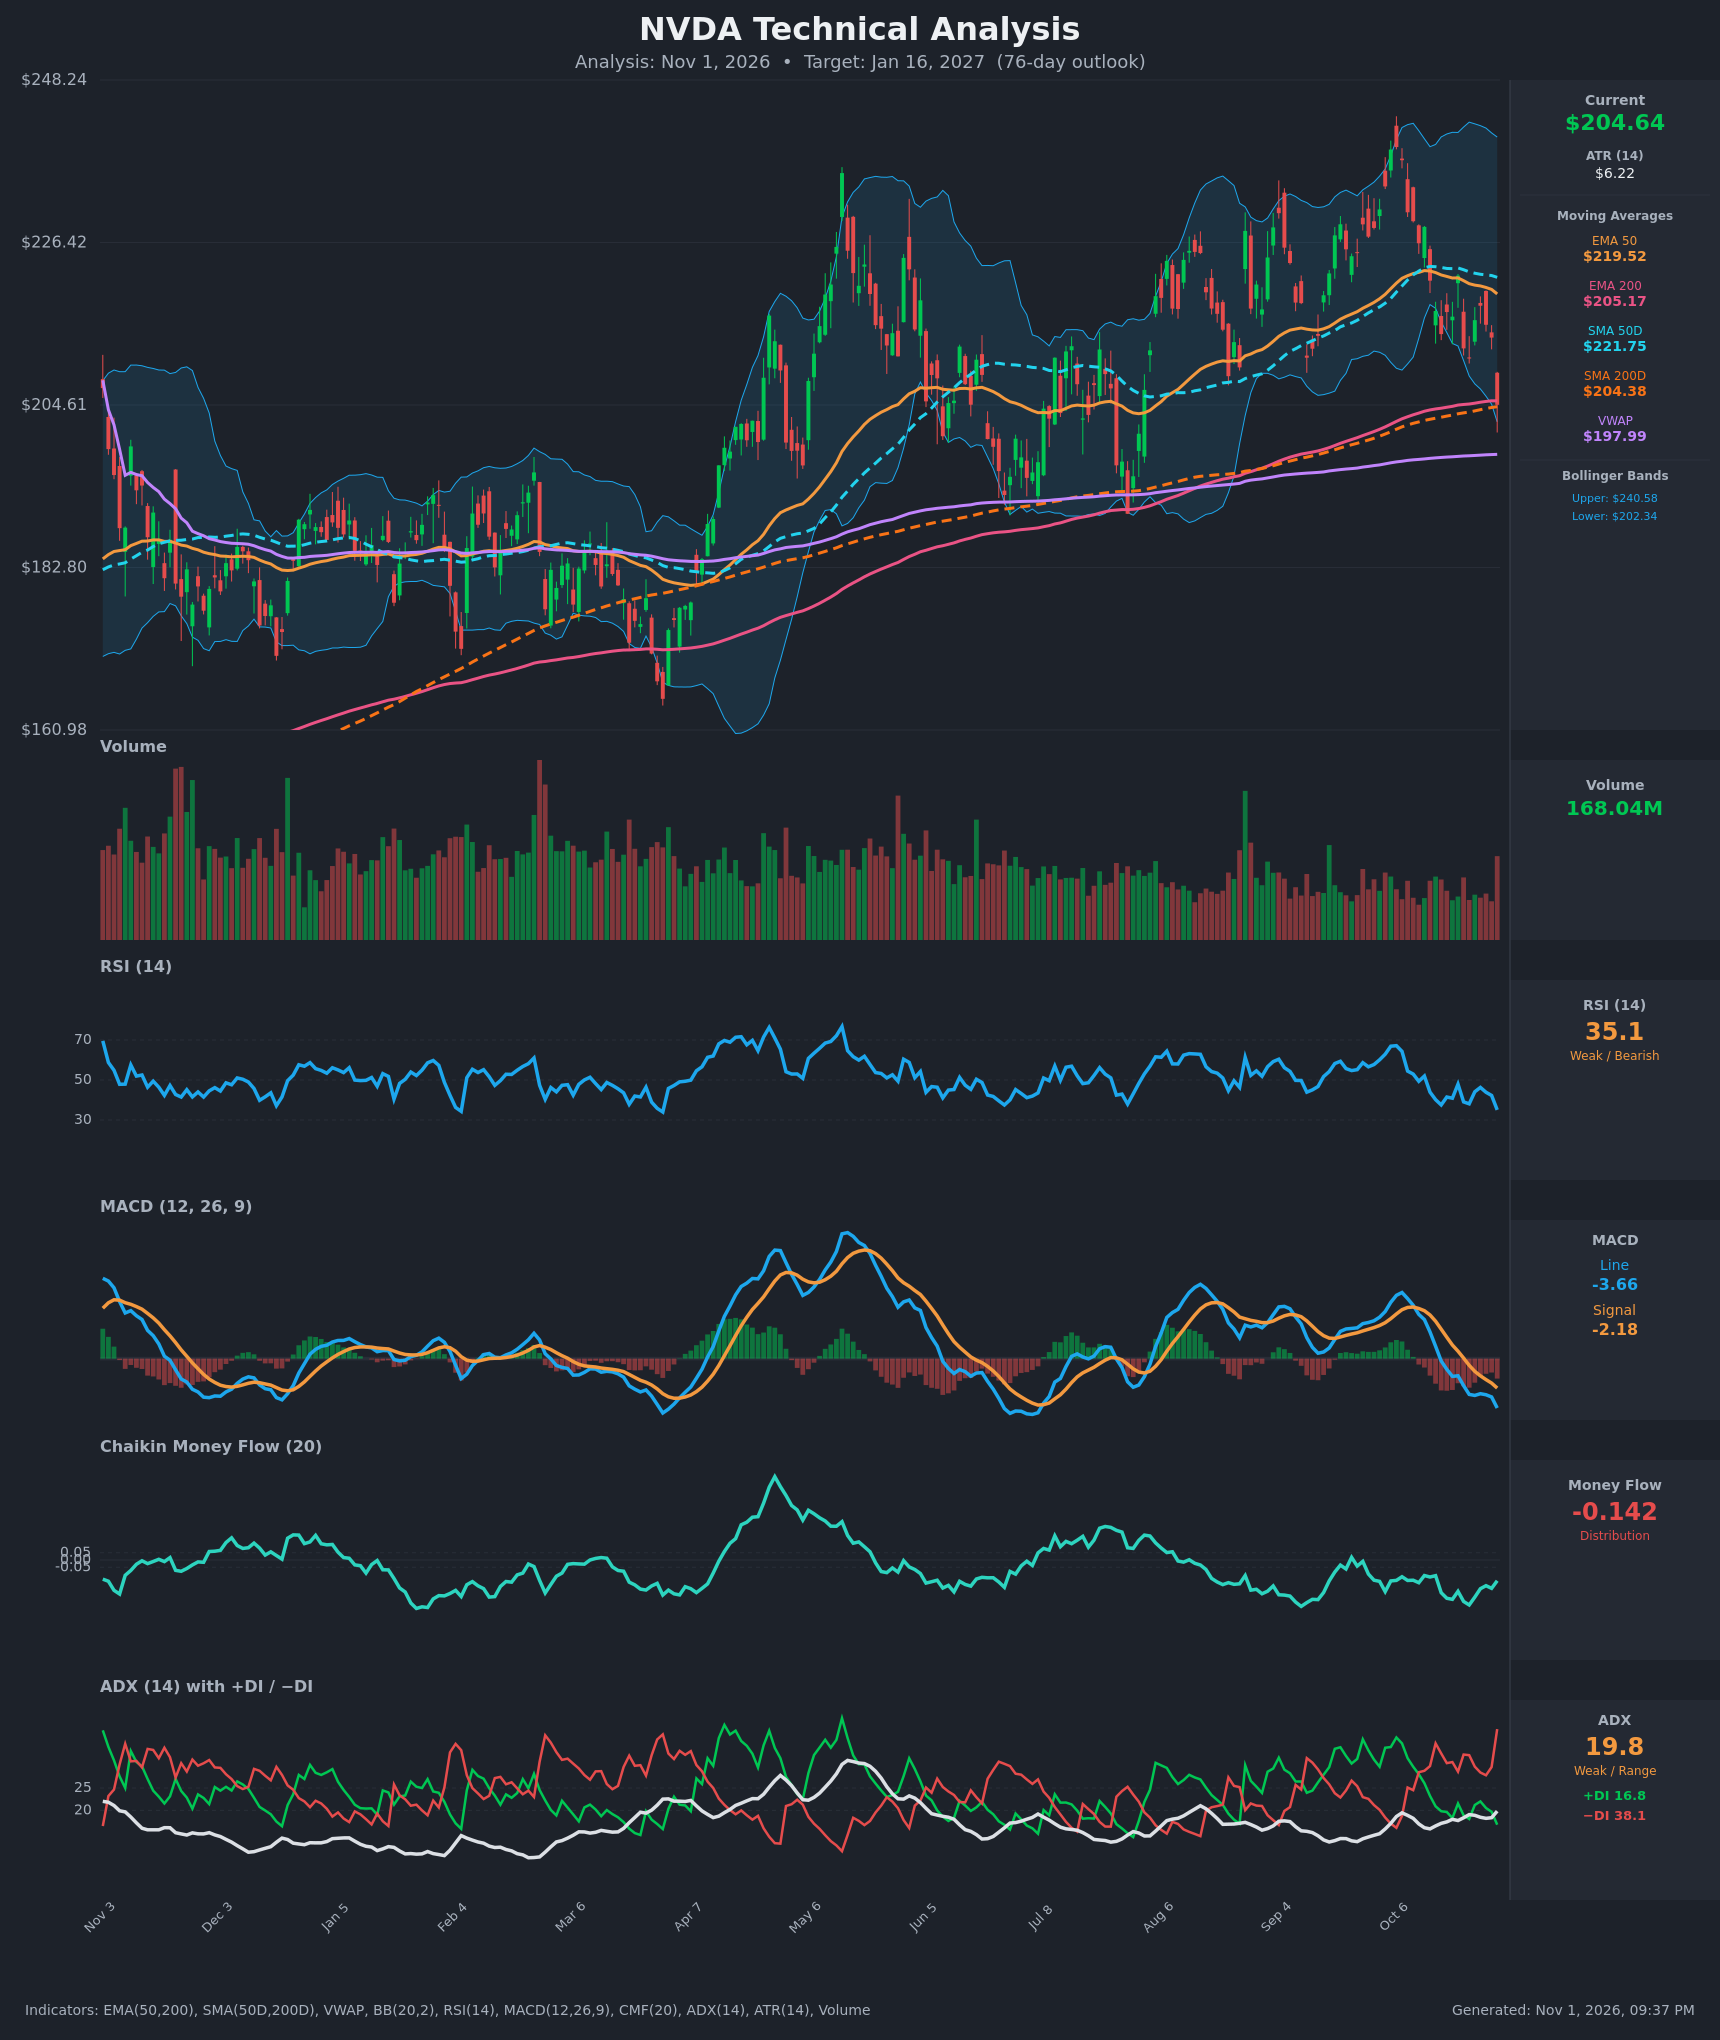
- RSI (14): 35.06, down from 47.9 on Oct 21 and close to the 30 oversold line. It has made lower highs through October, so momentum is still falling, though a bounce is possible near 30. [Bearish]
- 20 EMA: The 20 EMA isn't given, but price sits well below the EMA 50 ($219.52) and SMA 50D ($221.75), which now act as overhead resistance. Price is only just above EMA 200 ($205.17, actually $0.53 above price) and SMA 200D ($204.38), the last long-term support cluster. Price has been below the short-term average since Oct 14. [Bearish]
- MACD: Line -3.66 is below signal -2.18 and the gap is widening. The bearish crossover happened Oct 16 and the line has been negative since. The histogram is negative and still deepening. [Bearish]
- Bollinger Bands (20): Price at $204.64 is near the lower band ($202.34) and far from the upper ($240.58). The bands are wide after the October volatility. A lower-band walk is bearish, but a touch of the band can also trigger mean-reversion bounces. [Bearish]
- CMF (20): -0.142, well below -0.05 and stuck between -0.11 and -0.31 for the whole recent window. This shows persistent distribution, and there is no sign of accumulation yet. [Distribution]
- ADX (14): 19.8 with -DI at 38.1 against +DI at 16.8. ADX is weak, but it is rising off its lows (15.9 to 19.8) and the DI spread is the widest in the window. That suggests a downtrend is trying to establish itself. [Weak Trend, Bearish direction]
- Volume: 168.04M, a heavier bar on the red Oct 30 drop. Volume has been expanding on declines in October. [Selling pressure / Bearish]
DIVERGENCES & TRENDS
- There is no clear bullish divergence yet. RSI is making lower lows alongside price (37.5 on Oct 16, 38.1 on Oct 23, 35.1 on Oct 30), so momentum confirms price.
- MACD is still falling after the Oct 16 bearish crossover, and the histogram is expanding negative.
- The −DI/+DI spread widened from 28.5/28.1 on Oct 12 to 38.1/16.8 on Oct 30. This is a decisive shift in control to sellers.
- The EMA 50 (219.52) and SMA 50D (221.75) have rolled over and are falling. They are still above the rising 200-day averages, so there is no death cross and the long-term uptrend is technically intact. A gap of about $15 between the two groups is closing.
- Price is testing the 200-day confluence (EMA 200 $205.17, SMA 200D $204.38). VWAP at $197.99 is the next floor below.
CHART PATTERNS
- The October top at about $245, followed by a lower-high rally to about $228 and a break lower, resembles a Bearish Double Top / Head and Shoulders shape from the reference. The loose neckline sits around the 200-day averages and VWAP, roughly $198–205, and the Aug low near $190 is the next reference. A decisive break would project toward the $180s. The pattern is imperfect, since the peaks are unequal, so treat it as a tentative read.
- The year-long structure from Jun to Oct is a rising channel of higher lows. This is a Bearish Rising Wedge-style structure, and a break of the 200-day cluster would invalidate the series of higher lows.
- The alternative reading is a Bullish Flag / consolidation within a long-term uptrend, which would call for a bounce at the 200-day averages. The indicators do not support it yet.
POTENTIAL SCENARIOS
- Scenario 1: Bearish Break of the 200-Day Cluster — Price loses the EMA/SMA 200 confluence and VWAP, and the distribution (CMF) and −DI dominance carry the decline. Trigger: daily close below $198 (VWAP) on above-average volume. Target: $185–$190, with a 76-day outcome near $196 allowing for bounces. Invalidation: daily close back above $221 (SMA 50D / EMA 50). (50% probability)
- Scenario 2: Bullish Bounce off 200-Day Support — RSI turns up from near 30 and the 200-day averages hold as in prior pullbacks. Trigger: reclaim of $212 with a MACD histogram turn and CMF back above 0. Target: $220–$225 (EMA 50 / SMA 50D), possibly $235. Invalidation: daily close below $198. (30% probability)
- Scenario 3: Neutral Range Between Averages — Price chops between VWAP ($198) and the 50-day averages ($220), with weak ADX leaving it pinned in the range. Trigger: failed breakdown and failed rally. Target: $200–$215. Invalidation: close outside $195–$222. (20% probability)
PRICE TARGETS
- Target Price: $196.00 (76-day)
- Expected Range: $176.00 to $230.00 (width $54, about 26% of current price)
- Key Levels: Support at $197.99 (VWAP), Resistance at $219.52 (EMA 50)
OVERALL BIAS
OVERALL BIAS: BEARISH - Price has lost the 50-day averages, RSI is 35, the MACD is in a bearish crossover and widening, CMF shows persistent distribution (-0.142), and −DI (38.1) dominates +DI (16.8). The rising 200-day averages and VWAP just below price offer support, which limits the downside target to the mid-$190s with a wide range.
This is educational analysis and not financial advice.