QBTS 76-day bearish forecast — Nov 1, 2026
- Bias: Bearish
- Timeframe: 76 days (made Nov 1, 2026, target date Jan 15, 2027)
- Price at analysis: $10.65
- Price target: $9.20
- Expected range: $6.90 – $13.00
- Result: Pending — graded after the close on Jan 15, 2027
Get a free AI analysis of QBTS today
Analysis
TECHNICAL INDICATORS
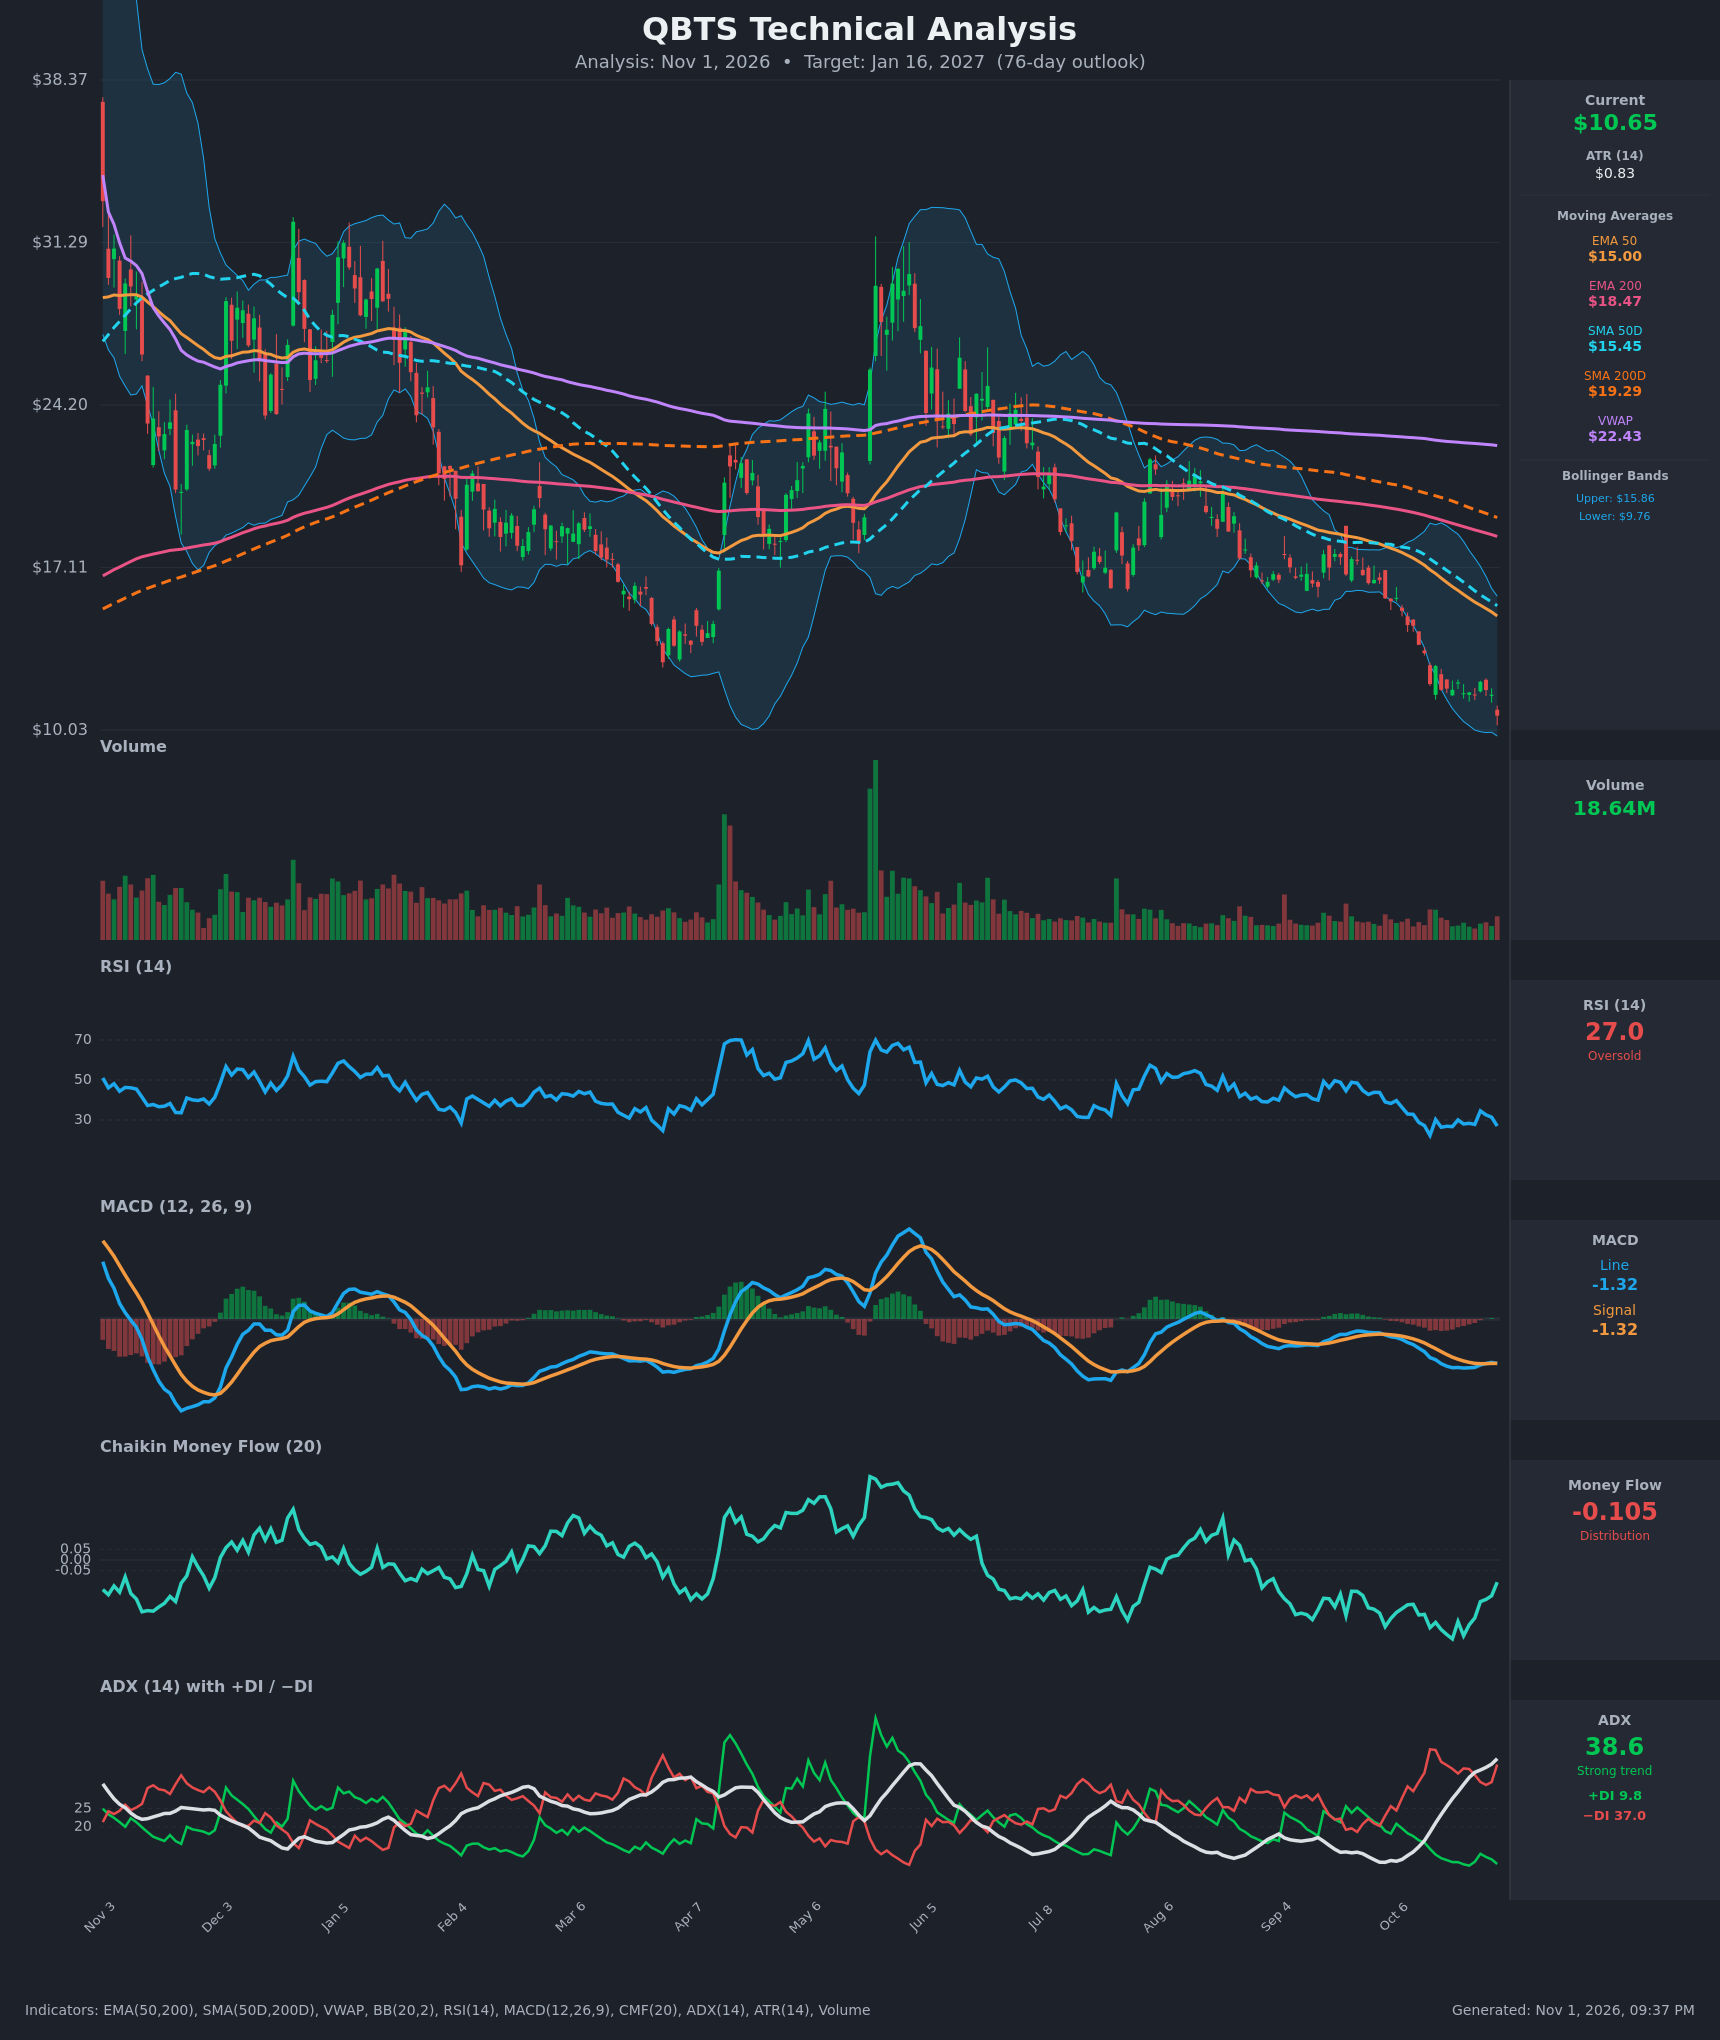
- RSI (14): 26.98, in oversold territory (<30) and sliding back down after a brief bounce to 34.6 on Oct 27. It has stayed in the 22-35 range for about three weeks, which shows persistent downside momentum rather than a reversal. [Bearish]
- 20 EMA: Not supplied, but price ($10.65) sits far below EMA 50 ($15.00), EMA 200 ($18.47), SMA50D ($15.45), SMA200D ($19.29) and VWAP ($22.43). Every moving average is stacked overhead as resistance. [Bearish]
- MACD: Line -1.32 and signal -1.32 are essentially flat on each other, with a near-zero histogram. The line has been rolling over again after a brief improvement. Momentum is deeply negative but no longer accelerating, and a fresh bearish crossover is forming. [Bearish]
- Bollinger Bands (20): Price at $10.65 is near the lower band ($9.76), well below the midline (~$12.8) and just above the $10.03 chart floor. The bands are fairly wide after the sell-off. Walking the lower band signals a strong downtrend, though it is stretched and a relief bounce is possible. [Bearish]
- CMF (20): -0.105, below the -0.05 threshold, so selling pressure is dominant. It has improved from -0.37 to -0.105 over the last two weeks, which hints at weakening distribution but not accumulation. [Distribution]
- ADX (14): 38.6 and rising, with −DI (37.0) far above +DI (9.8). This is a strong, established downtrend with bulls almost absent. [Strong Trend – Bearish]
- Volume: 18.64M on the latest bar, a down day. Volume has been subdued and declining through the fall, with a small uptick on the latest drop. There is no capitulation spike yet, which would typically mark a durable bottom. [Neutral-to-Bearish]
DIVERGENCES & TRENDS
- Moving averages: Price is below the SMA200D and EMA200 (long-term downtrend). SMA50D ($15.45) is below SMA200D ($19.29) and EMA50 is below EMA200, so the death cross is already in place and the gap is widening.
- RSI vs price: There is no bullish divergence. Price made a new low at $10.65 and RSI (27.0) is near its prior lows (22.3 on Oct 14, 26.4 on Oct 16). RSI made a higher low on Oct 20-26 against lower closes, which is a very minor, unconfirmed hint at stabilization.
- CMF: It has been improving from -0.37 to -0.105 even as price drifted lower, a mild bullish divergence. It is still below -0.05 and needs to cross above zero to matter.
- MACD: The MACD line is rolling over and sits on the signal line (-1.322 vs -1.320), a marginal bearish cross on the latest bar. Oct 27's bullish tilt was short-lived.
- ADX/DI: −DI has dominated since mid-October and ADX has climbed from 14.5 to 38.6, confirming a strengthening downtrend. No DI crossover is near.
- Trend: The chart shows a series of lower highs and lower lows since the May peak (~$31). The latest decline broke the ~$17 support and the August-September consolidation around $12-13, and the lower band is being tested.
CHART PATTERNS
- Bearish Rising Wedge / Bearish Flag (continuation): The mid-September to October price action formed a rising channel of small ranges around $17-$18 that broke down violently. The sharp drop from ~$17 to ~$12 matches a bearish continuation breakdown.
- Consolidation at $11.5-$12.5: A tight range over the last ~2 weeks resembles a Bearish Pennant/Flag. The breakdown below $11.54 to $10.65 is the continuation trigger. A measured move from the flagpole (~$17 to ~$12, about $5) points toward roughly $6.5-$7.5 as an extended target, although the ~$10 level is the first support (a prior chart low near $10.03).
- Larger picture: A descending structure of lower highs from $38 down to $10.65 resembles a long Descending Triangle/channel. Absent a base such as a double bottom, the trend favors lower prices.
POTENTIAL SCENARIOS
- Scenario 1: Bearish Trend Continuation — The pennant breakdown extends with −DI dominance and the stacked moving averages acting as resistance. Price breaks the $10.03 chart floor and the lower Bollinger Band ($9.76), grinding toward the ~$8 area. Trigger: daily close below $9.76 on rising volume. Target: $8.00, with an extension toward $7. Invalidation: close above $13.00 (back above the Bollinger midline and the consolidation range). (50% probability)
- Scenario 2: Bearish-Biased Oversold Bounce Then Fade — RSI below 30 and CMF improvement spark a relief rally into the $12.5-$14 zone (the prior consolidation and falling EMA50/SMA50D), which then fails and rolls over. Price ends the period slightly below the current level. Trigger: hold of $10 followed by a reclaim of $12.13. Target: $12.50-$13.50 bounce, then fade to ~$10. Invalidation: weekly close above $15.50 (SMA50D/EMA50). (30% probability)
- Scenario 3: Bullish Trend Reversal — Capitulation volume forms a base (double bottom) and price recovers above the EMA50 as short covering builds. Trigger: bullish MACD cross, RSI above 50 and +DI crossing above −DI. Target: $15.00-$15.50. Invalidation: close below $9.00. (20% probability)
PRICE TARGETS
- Target Price: $9.20 (76-day horizon)
- Expected Range: $6.90 to $13.00 (width $6.10, about 57% of current price; this is wider than the 18-30% guide for 61-180 days because QBTS is a high-volatility stock with ATR of ~8% of price and an extreme trend, so the range is deliberately broadened and reflects both the bounce and breakdown scenarios)
- Key Levels: Support at $9.76 (lower Bollinger Band; next $8.00), Resistance at $12.13 (recent bounce high; next $15.00 EMA50)
OVERALL BIAS
OVERALL BIAS: BEARISH - The death cross is confirmed and every moving average is overhead, with ADX at 38.6 and −DI (37.0) far above +DI (9.8). CMF is still in distribution and price is breaking down from a bearish pennant, so continuation toward the high-$8s is favored despite oversold RSI and a possible relief bounce.
This is educational analysis and not financial advice.