PLTR 76-day bearish forecast — Nov 1, 2026
- Bias: Bearish
- Timeframe: 76 days (made Nov 1, 2026, target date Jan 15, 2027)
- Price at analysis: $184.11
- Price target: $174.00
- Expected range: $154.00 – $197.00
- Result: Pending — graded after the close on Jan 15, 2027
Get a free AI analysis of PLTR today
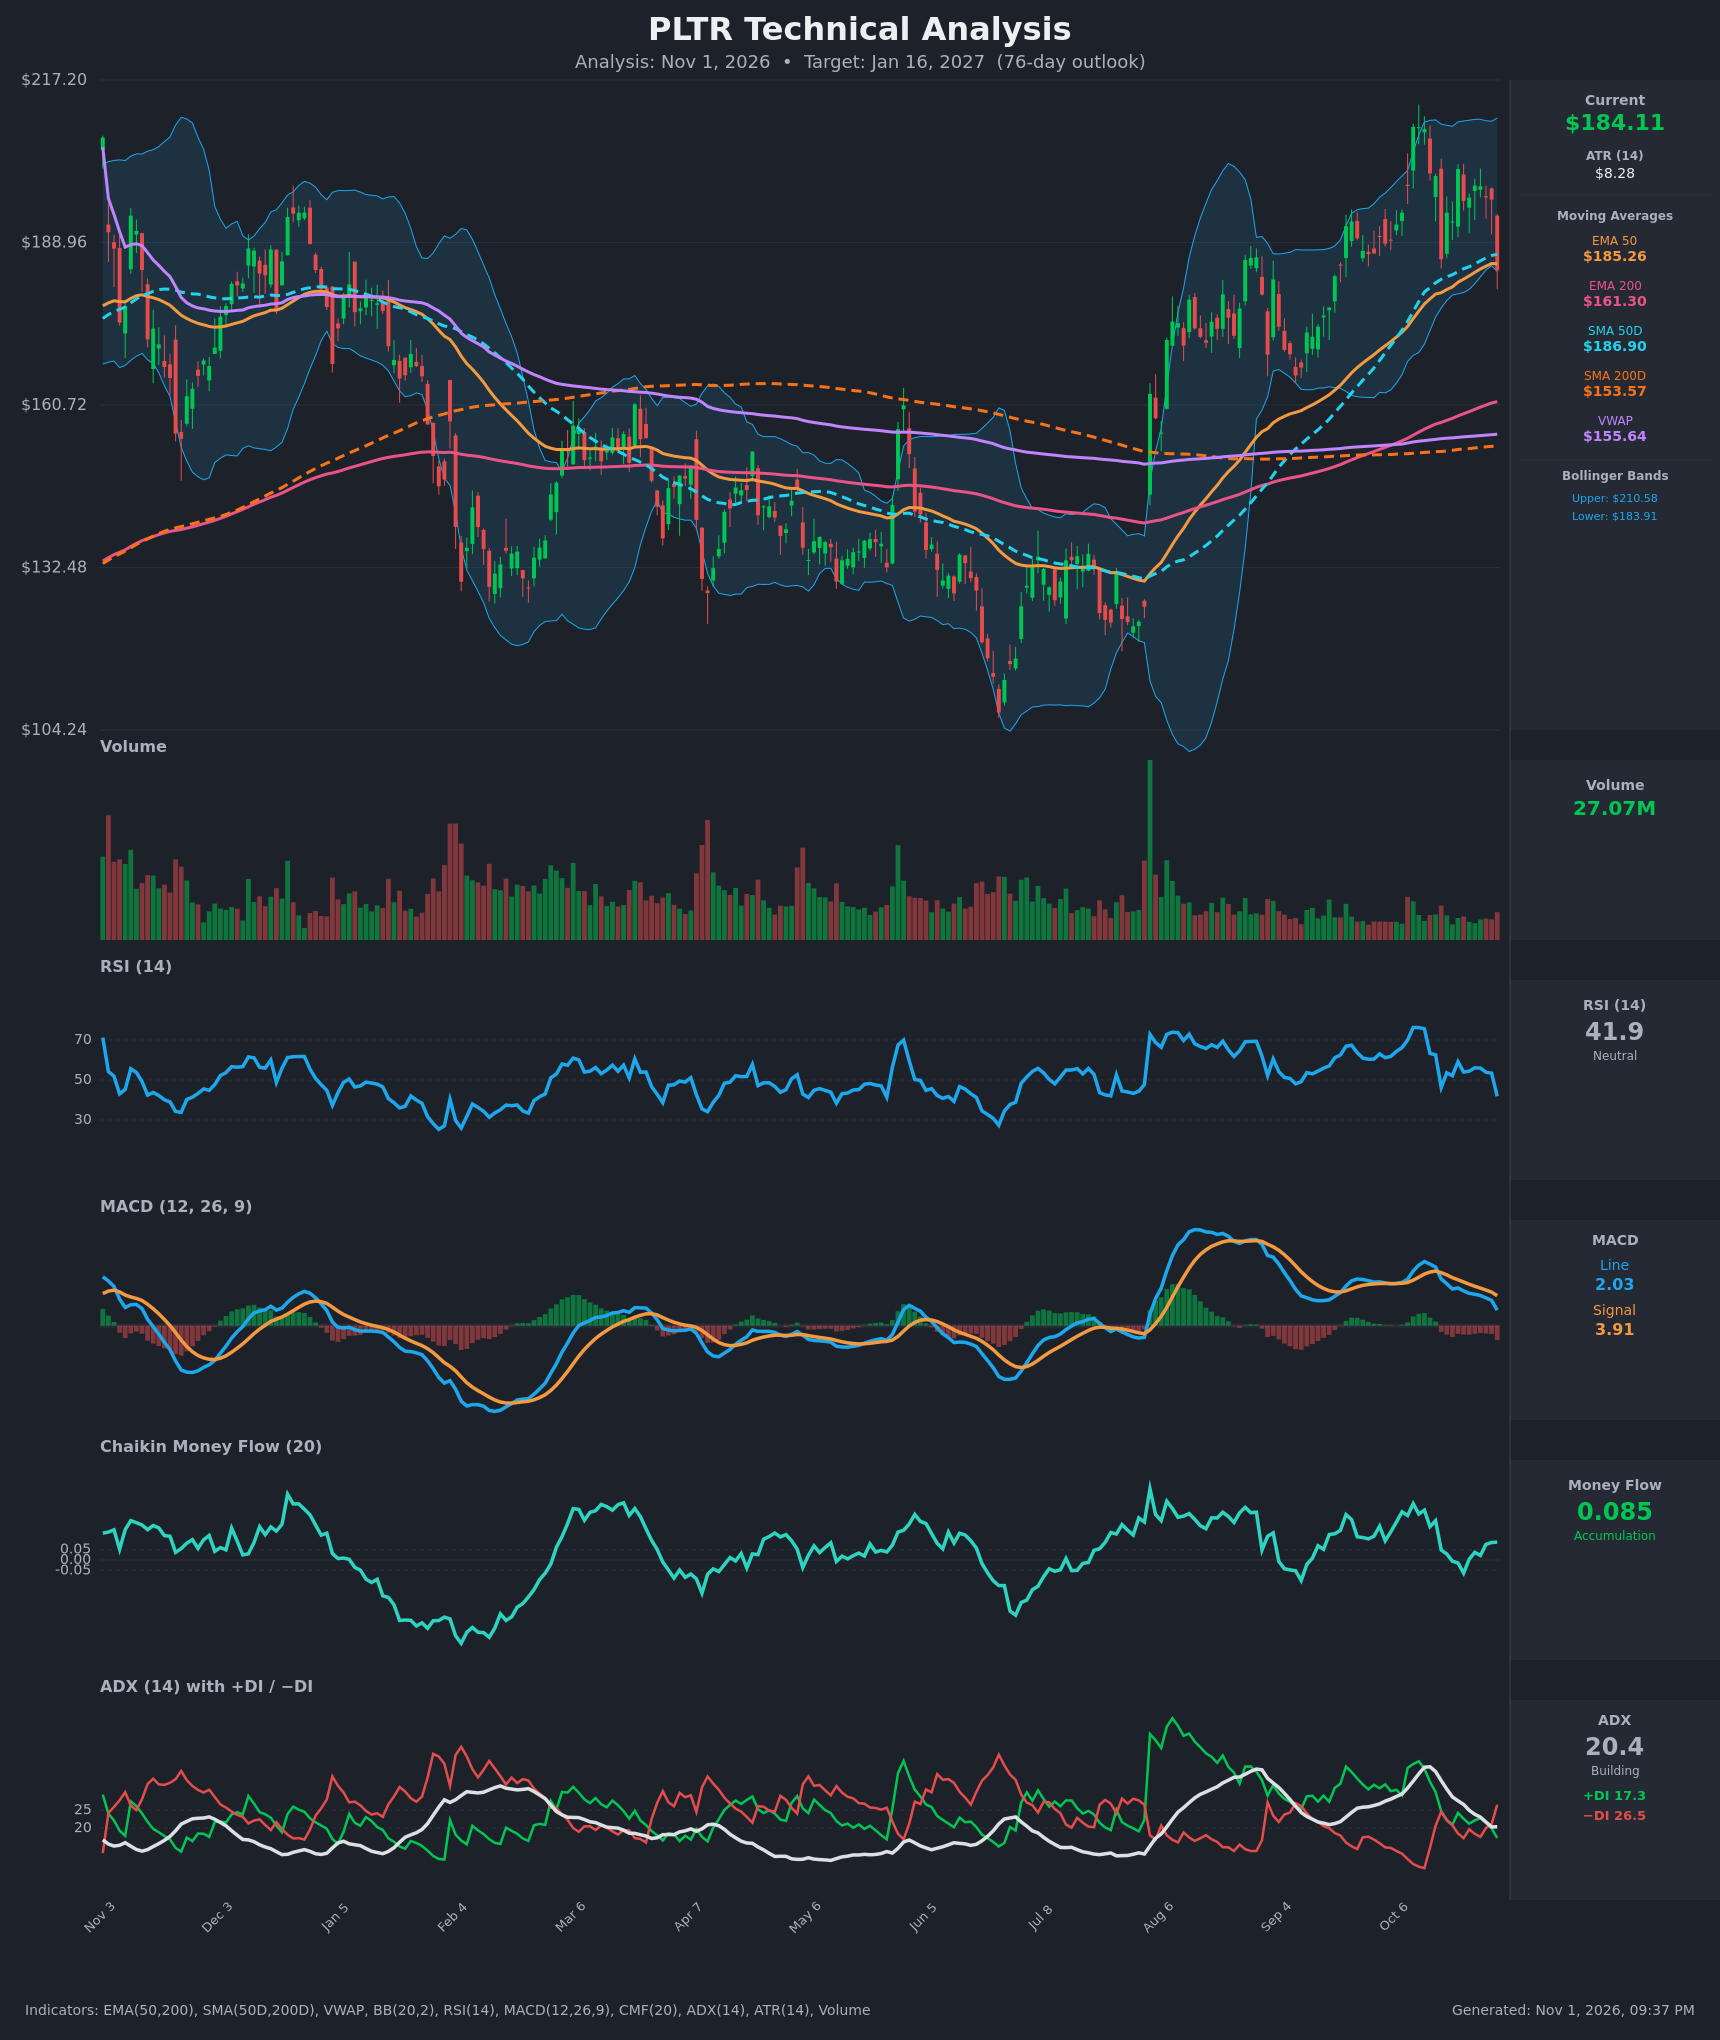
Analysis
TECHNICAL INDICATORS
- RSI (14): 41.86, down sharply from 53.4 the prior day and 76 on Oct 12. It has dropped below the 50 midline and is heading toward 30, but is not oversold. Momentum is clearly fading. [Bearish]
- 20 EMA: The 20 EMA is not supplied. The nearest proxies are the EMA 50 at $185.26 and SMA 50D at $186.90, and price ($184.11) closed below both after the -6.3% drop on Oct 30. Both are now overhead resistance. [Bearish]
- MACD: The line (2.03) is below the signal (3.91). The bearish crossover happened around Oct 16, and the gap widened on Oct 30. The histogram is negative and still falling, with the line decaying from its Oct 13 peak of 8.4. [Bearish]
- Bollinger Bands (20): Price at $184.11 sits right on the lower band ($183.91), against an upper band of $210.58. The bands are wide, so volatility is high. A close on the lower band after a big red candle shows selling pressure and offers a possible mean-reversion bounce. A walk down the band is possible if support fails. [Neutral]
- CMF (20): 0.085, still above +0.05. It has been fading from 0.237 and hovers near zero, so buying pressure is weakening but not yet distribution. [Accumulation]
- ADX (14): 20.4 with −DI (26.5) above +DI (17.3). The trend is weak and range-bound, but control flipped to the bears on Oct 30. The ADX has fallen from 37 and is only now stabilising. [Weak Trend, bearish lean]
- Volume: 27.07M on the -6.3% down day, about average relative to the chart's volume bars. There is no capitulation spike, but a decisive down candle on solid volume suggests distribution at the highs. [Mildly Bearish]
DIVERGENCES & TRENDS
- Price made a high near $209 (Oct 12–13) while the MACD histogram and RSI have rolled over since. There is a mild bearish momentum divergence versus the 7.9–8.4 MACD peak.
- The lower high at $201.72 (Oct 21) and the lower MACD peak at 4.9 confirm weakening upside momentum.
- The EMA 50 ($185.26) and SMA 50D ($186.90) are still rising but are now being tested from below. A golden cross is already in place (SMA 50D $186.90 > SMA 200D $153.57, EMA 50 > EMA 200), so the long-term trend is up.
- Price is well above the SMA 200D ($153.57), the EMA 200 ($161.30) and VWAP ($155.64). That supports the long-term uptrend, so downside is likely a correction rather than a trend reversal.
- The DI crossover (−DI over +DI) and the MACD crossover are both fresh bearish signals. CMF remains positive, which is the main conflicting signal.
CHART PATTERNS
- Bearish Double Top (reversal): Peaks near $209 (Oct 12–13) and a lower retest near $201 (Oct 21), with a neckline around $184–186 that price is now testing. A confirmed close below it projects a measured move of about $25 to roughly $159. That target sits close to the EMA 200 and the old breakout area.
- Alternative (Bullish Flag / consolidation): The rally from Aug (~$130 to ~$209) followed by a sideways-to-lower channel could be a bullish flag if price holds the $184 area. A hold and reclaim of $190+ would favour a retest of $200–210.
- The double top is the more plausible read given the bearish MACD and DI signals, but the neckline has not yet been cleanly broken.
POTENTIAL SCENARIOS
- Scenario 1: Bearish Double-Top Breakdown and Pullback to the EMA 200 — Price loses the $184 neckline and the 50-day MAs turn to resistance, with a correction toward the rising EMA 200 and the gap-fill zone. Trigger: daily close below $183 with −DI rising above 28 and MACD staying below signal. Target: $165–$174, with an extension to $159–$161. Invalidation: a daily close above $197. (50% probability)
- Scenario 2: Bullish Bounce / Flag Resumption — Price holds the lower Bollinger Band and the 50-day MAs, CMF stays positive, and the uptrend resumes. Trigger: reclaim of $190 (SMA 50D) and MACD re-cross above signal. Target: $200–$210. Invalidation: close below $178. (35% probability)
- Scenario 3: Neutral Range — Price chops between the $175 and $198 band as ADX stays near 20. Trigger: failure of both breakdown and breakout. Target: $180–$190. Invalidation: close outside $172–$200. (15% probability)
PRICE TARGETS
- Target Price: $174.00 (76 days, about -5.5% from $184.11)
- Expected Range: $154.00 to $197.00 ($43 width ≈ 23.4% of current price, in line with the 61–180 day guidance of 18–30%)
- Key Levels: Support at $161.30 (EMA 200, near the double-top measured move), Resistance at $196.50 (recent consolidation highs and the Oct 29 close)
OVERALL BIAS
OVERALL BIAS: BEARISH - Price broke below the EMA 50 and SMA 50D onto the lower Bollinger Band. The MACD and DI crossovers are bearish, RSI has fallen below 50, and a double-top neckline test points to a pullback toward the $160–$175 area. The long-term uptrend (above the 200-day averages, golden cross in place) and positive CMF limit the downside, so the correction is likely to be moderate.
This is educational analysis and not financial advice.