RKLB 76-day bearish forecast — Nov 1, 2026
- Bias: Bearish
- Timeframe: 76 days (made Nov 1, 2026, target date Jan 15, 2027)
- Price at analysis: $54.73
- Price target: $51.00
- Expected range: $43.00 – $58.50
- Result: Pending — graded after the close on Jan 15, 2027
Get a free AI analysis of RKLB today
Analysis
TECHNICAL INDICATORS
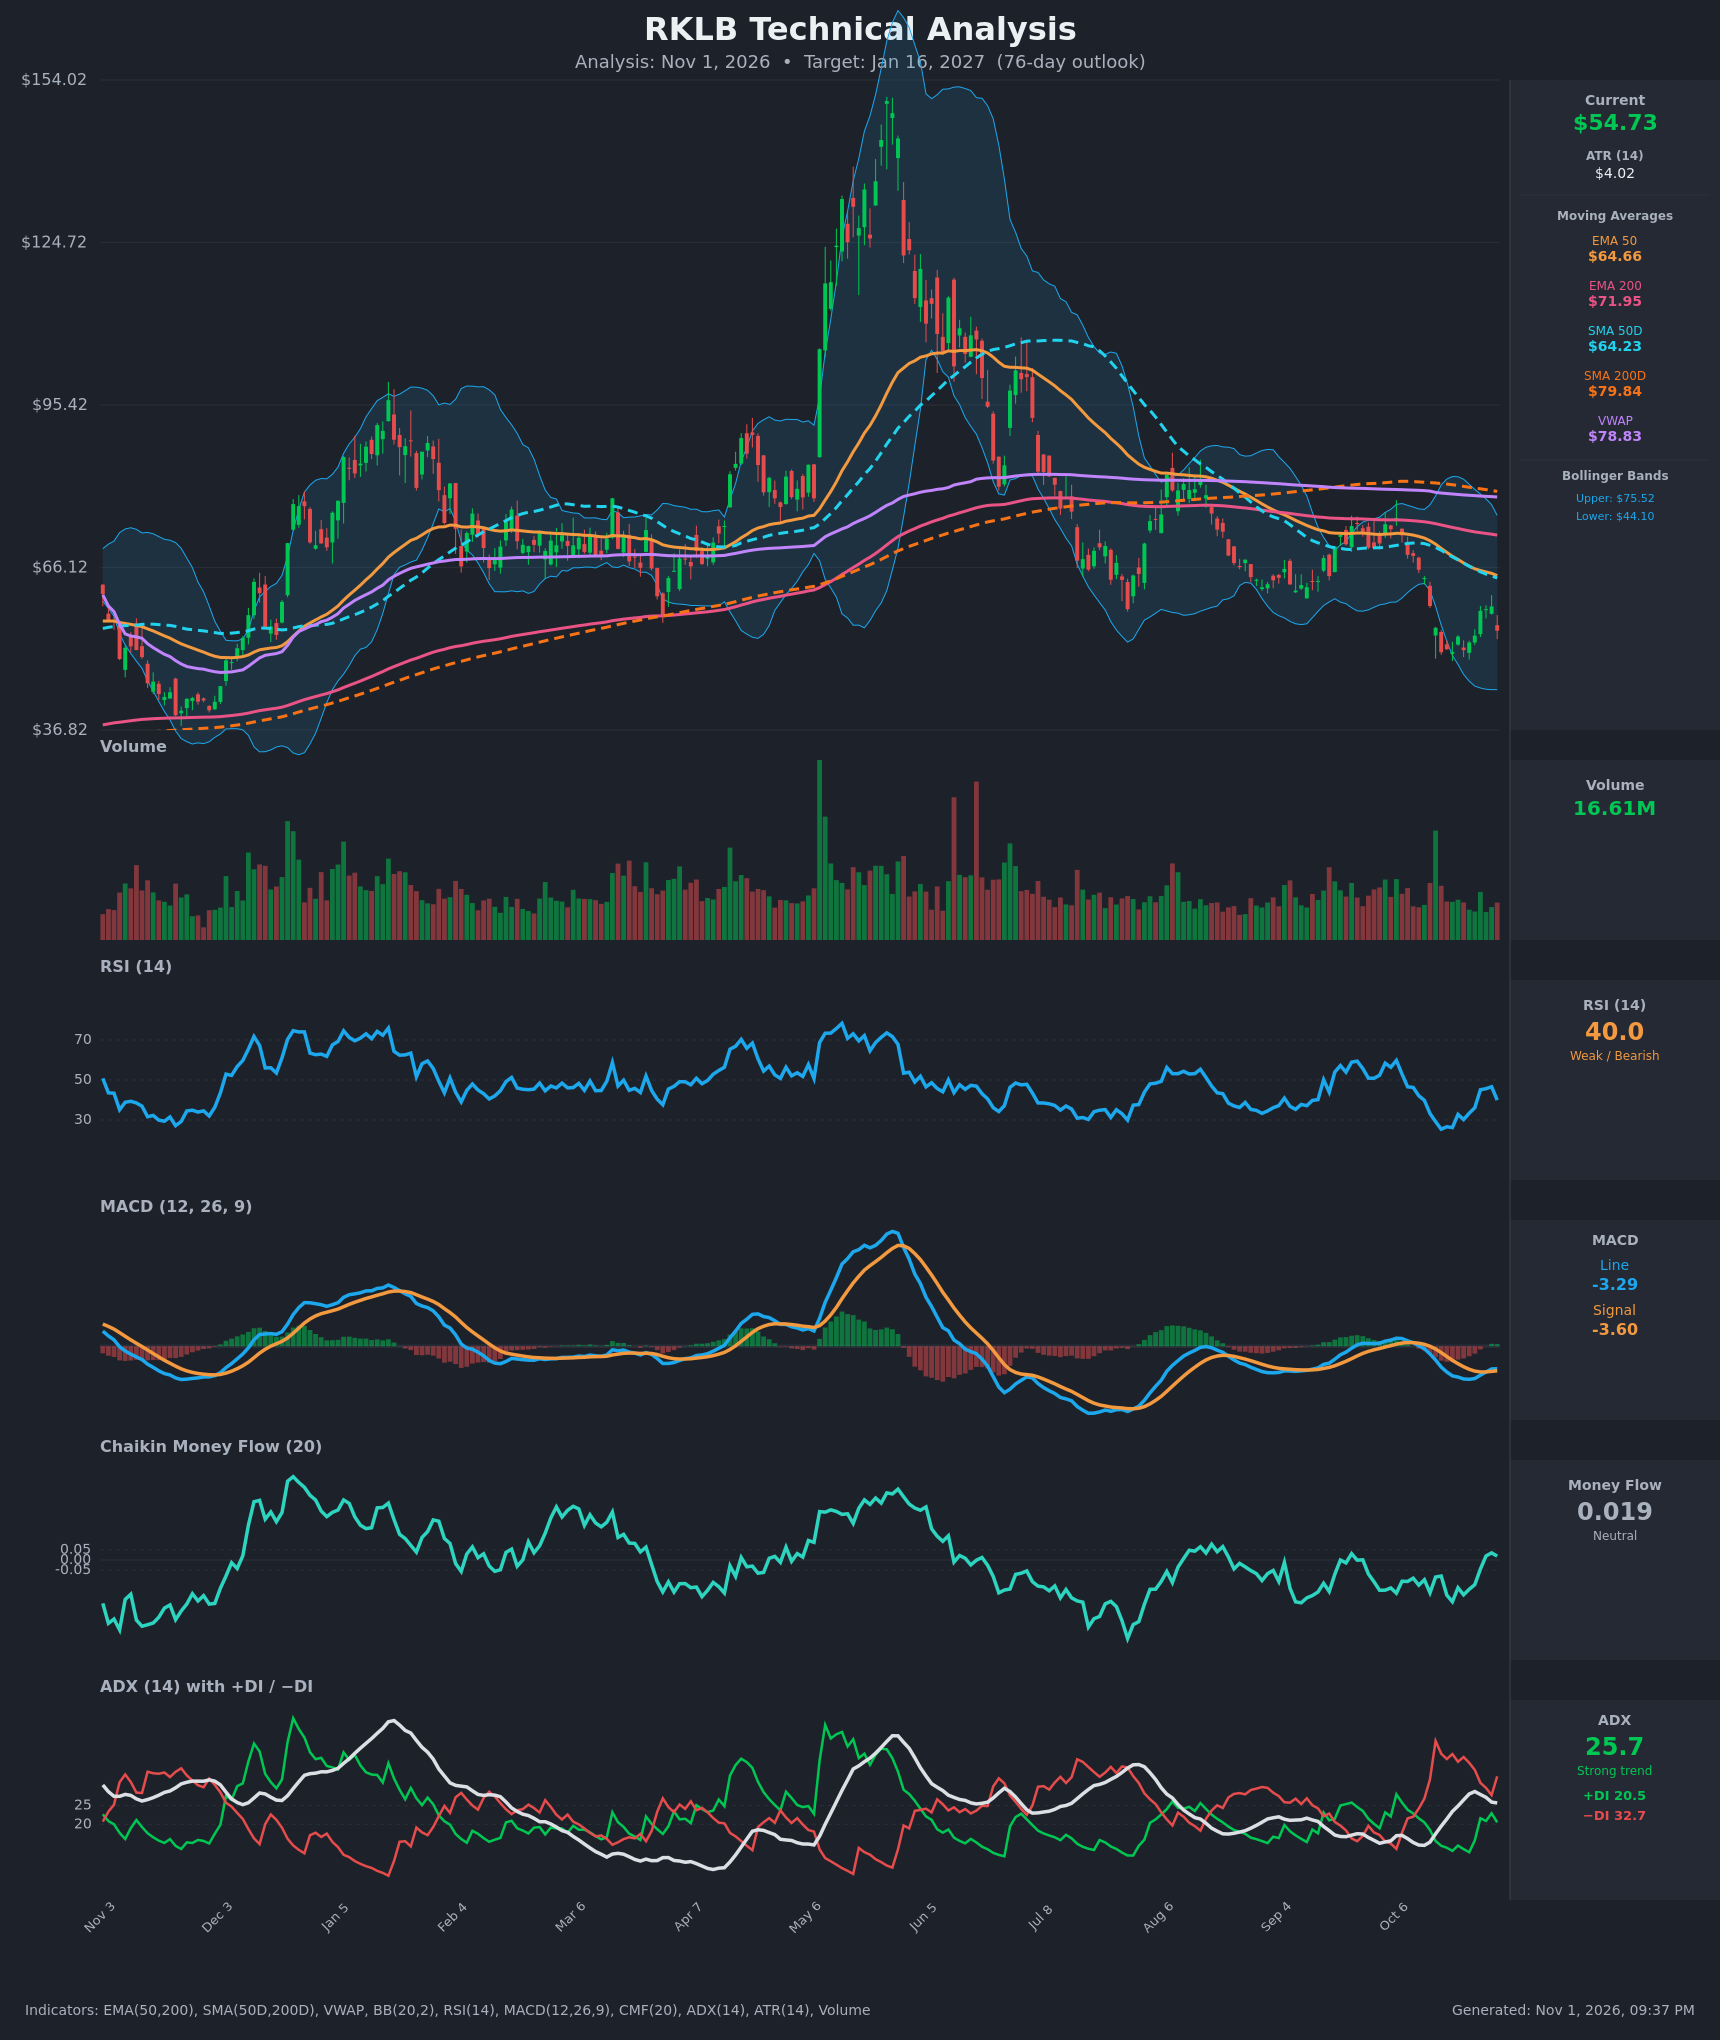
- RSI (14): 39.96. It bounced from oversold (25.4 on Oct 16) to 46.6 on Oct 29, then fell back to 40 after the latest down day. It is below 50 and has failed to reclaim the neutral line, which keeps momentum on the weak side. [Bearish]
- 20 EMA: The 20 EMA value wasn't provided, but price ($54.73) sits well below the EMA 50 ($64.66) and EMA 200 ($71.95). EMA 50 is below EMA 200, a bearish alignment, and both are sloping down. Price is also below the 50-day SMA ($64.23) and 200-day SMA ($79.84). The short-term rallies to $58-59 were sold. [Bearish]
- MACD: Line -3.288 is slightly above signal -3.598, a small bullish crossover on Oct 28. Both lines are deeply negative and the histogram is only barely positive (about +0.31), so this is a weak relief signal inside a downtrend. [Neutral]
- Bollinger Bands (20): Upper $75.52, lower $44.10, midline about $59.81. Price is in the lower half of the bands, below the midline. The recent rejection near the midline ($59) is typical of a downtrend, and the bands are wide, reflecting high volatility. [Bearish]
- CMF (20): 0.019, between -0.05 and +0.05. It has improved from about -0.2 to slightly positive, but it is not showing real accumulation. [Neutral]
- ADX (14): 25.7 with −DI (32.7) well above +DI (20.5). The trend is strong and bears are in control. ADX peaked at 28.7 and is easing slightly, a sign the downtrend may be maturing. [Strong Trend – Bearish]
- Volume: 16.61M, roughly average, with no capitulation spike. The Oct 30 drop (-7.4%) came on ordinary volume, so there is no clear exhaustion bottom. [Neutral-to-Bearish]
DIVERGENCES & TRENDS
- Mild bullish RSI divergence: Price made near-equal lows ($50.84, $50.90, $51.22) while RSI lows rose from 25.4 to 26.2 to 30.2. This hints at fading selling pressure.
- MACD and CMF: The MACD crossover and the CMF recovery from about -0.2 to slightly positive show momentum improving, but both are still around neutral or negative levels.
- Death cross in place: SMA 50 ($64.23) is below SMA 200 ($79.84), and EMA 50 is below EMA 200. Price is far below the 200-day SMA and VWAP ($78.83), confirming a long-term downtrend.
- DI structure: −DI has stayed above +DI since Oct 12, and the Oct 30 turn down widened the gap again.
- Failed bounce: The rally from $50.84 to $59.10 stalled below the 50-day SMA/EMA 50 zone ($64) and the Bollinger midline, then reversed sharply.
CHART PATTERNS
- Bearish Flag / Pennant (continuation): After the steep fall from the $80s to about $51, the choppy bounce to $59 resembles a bearish flag. A break below $50.84 would project a measured move of roughly $8-10 lower, toward $42-44, near the lower Bollinger Band. The prior major base on the chart is $36-40.
- Possible Triple/Double Bottom (bullish reversal): Three lows at about $50.8-51.2 form a potential base. It only becomes valid on a close above the $59.10 swing high, with a measured target of about $67 (near the 50-day SMA/EMA 50). Without that break it is just support.
- Overall: Price is in a long-term descending structure of lower highs after the May peak above $150.
POTENTIAL SCENARIOS
- Scenario 1: Bearish Flag Continuation — The downtrend resumes after the relief bounce fails below the Bollinger midline. Price retests $50.84 and breaks it, with −DI dominant. Trigger: daily close below $50.80 on rising volume. Target: $44-46 (lower band), with $51 as the expected 76-day area given a likely bounce along the way. Invalidation: daily close above $59.10. (50% probability)
- Scenario 2: Bullish Base Breakout — The triple-bottom area at $51 holds, with the RSI divergence and MACD crossover leading to a reversal. Trigger: close above $59.10 with CMF above +0.05. Target: $64-67 (EMA 50/SMA 50 cluster). Invalidation: close below $50.80. (28% probability)
- Scenario 3: Neutral Range — Price chops between $50.8 and $59 while ADX fades below 20. Trigger: failure to break either side. Target: $53-57. Invalidation: close outside the $50.80-$59.10 range. (22% probability)
PRICE TARGETS
- Target Price: $51.00 (76-day, about -6.8% from $54.73)
- Expected Range: $43.00 to $58.50 (width $15.50, about 28% of current price, consistent with the 61-180 day guidance of 18-30%)
- Key Levels: Support at $50.84, Resistance at $59.10
OVERALL BIAS
OVERALL BIAS: BEARISH - Price is below every major moving average with a death cross in place. −DI (32.7) dominates +DI (20.5) with ADX above 25, and the latest bounce failed below the Bollinger midline. The RSI divergence and MACD crossover argue for a bounce, but not yet a trend reversal.
This is educational analysis and not financial advice.