SMH 76-day bearish forecast — Nov 1, 2026
- Bias: Bearish
- Timeframe: 76 days (made Nov 1, 2026, target date Jan 15, 2027)
- Price at analysis: $522.49
- Price target: $495.00
- Expected range: $448.00 – $578.00
- Result: Pending — graded after the close on Jan 15, 2027
Get a free AI analysis of SMH today
Analysis
TECHNICAL INDICATORS
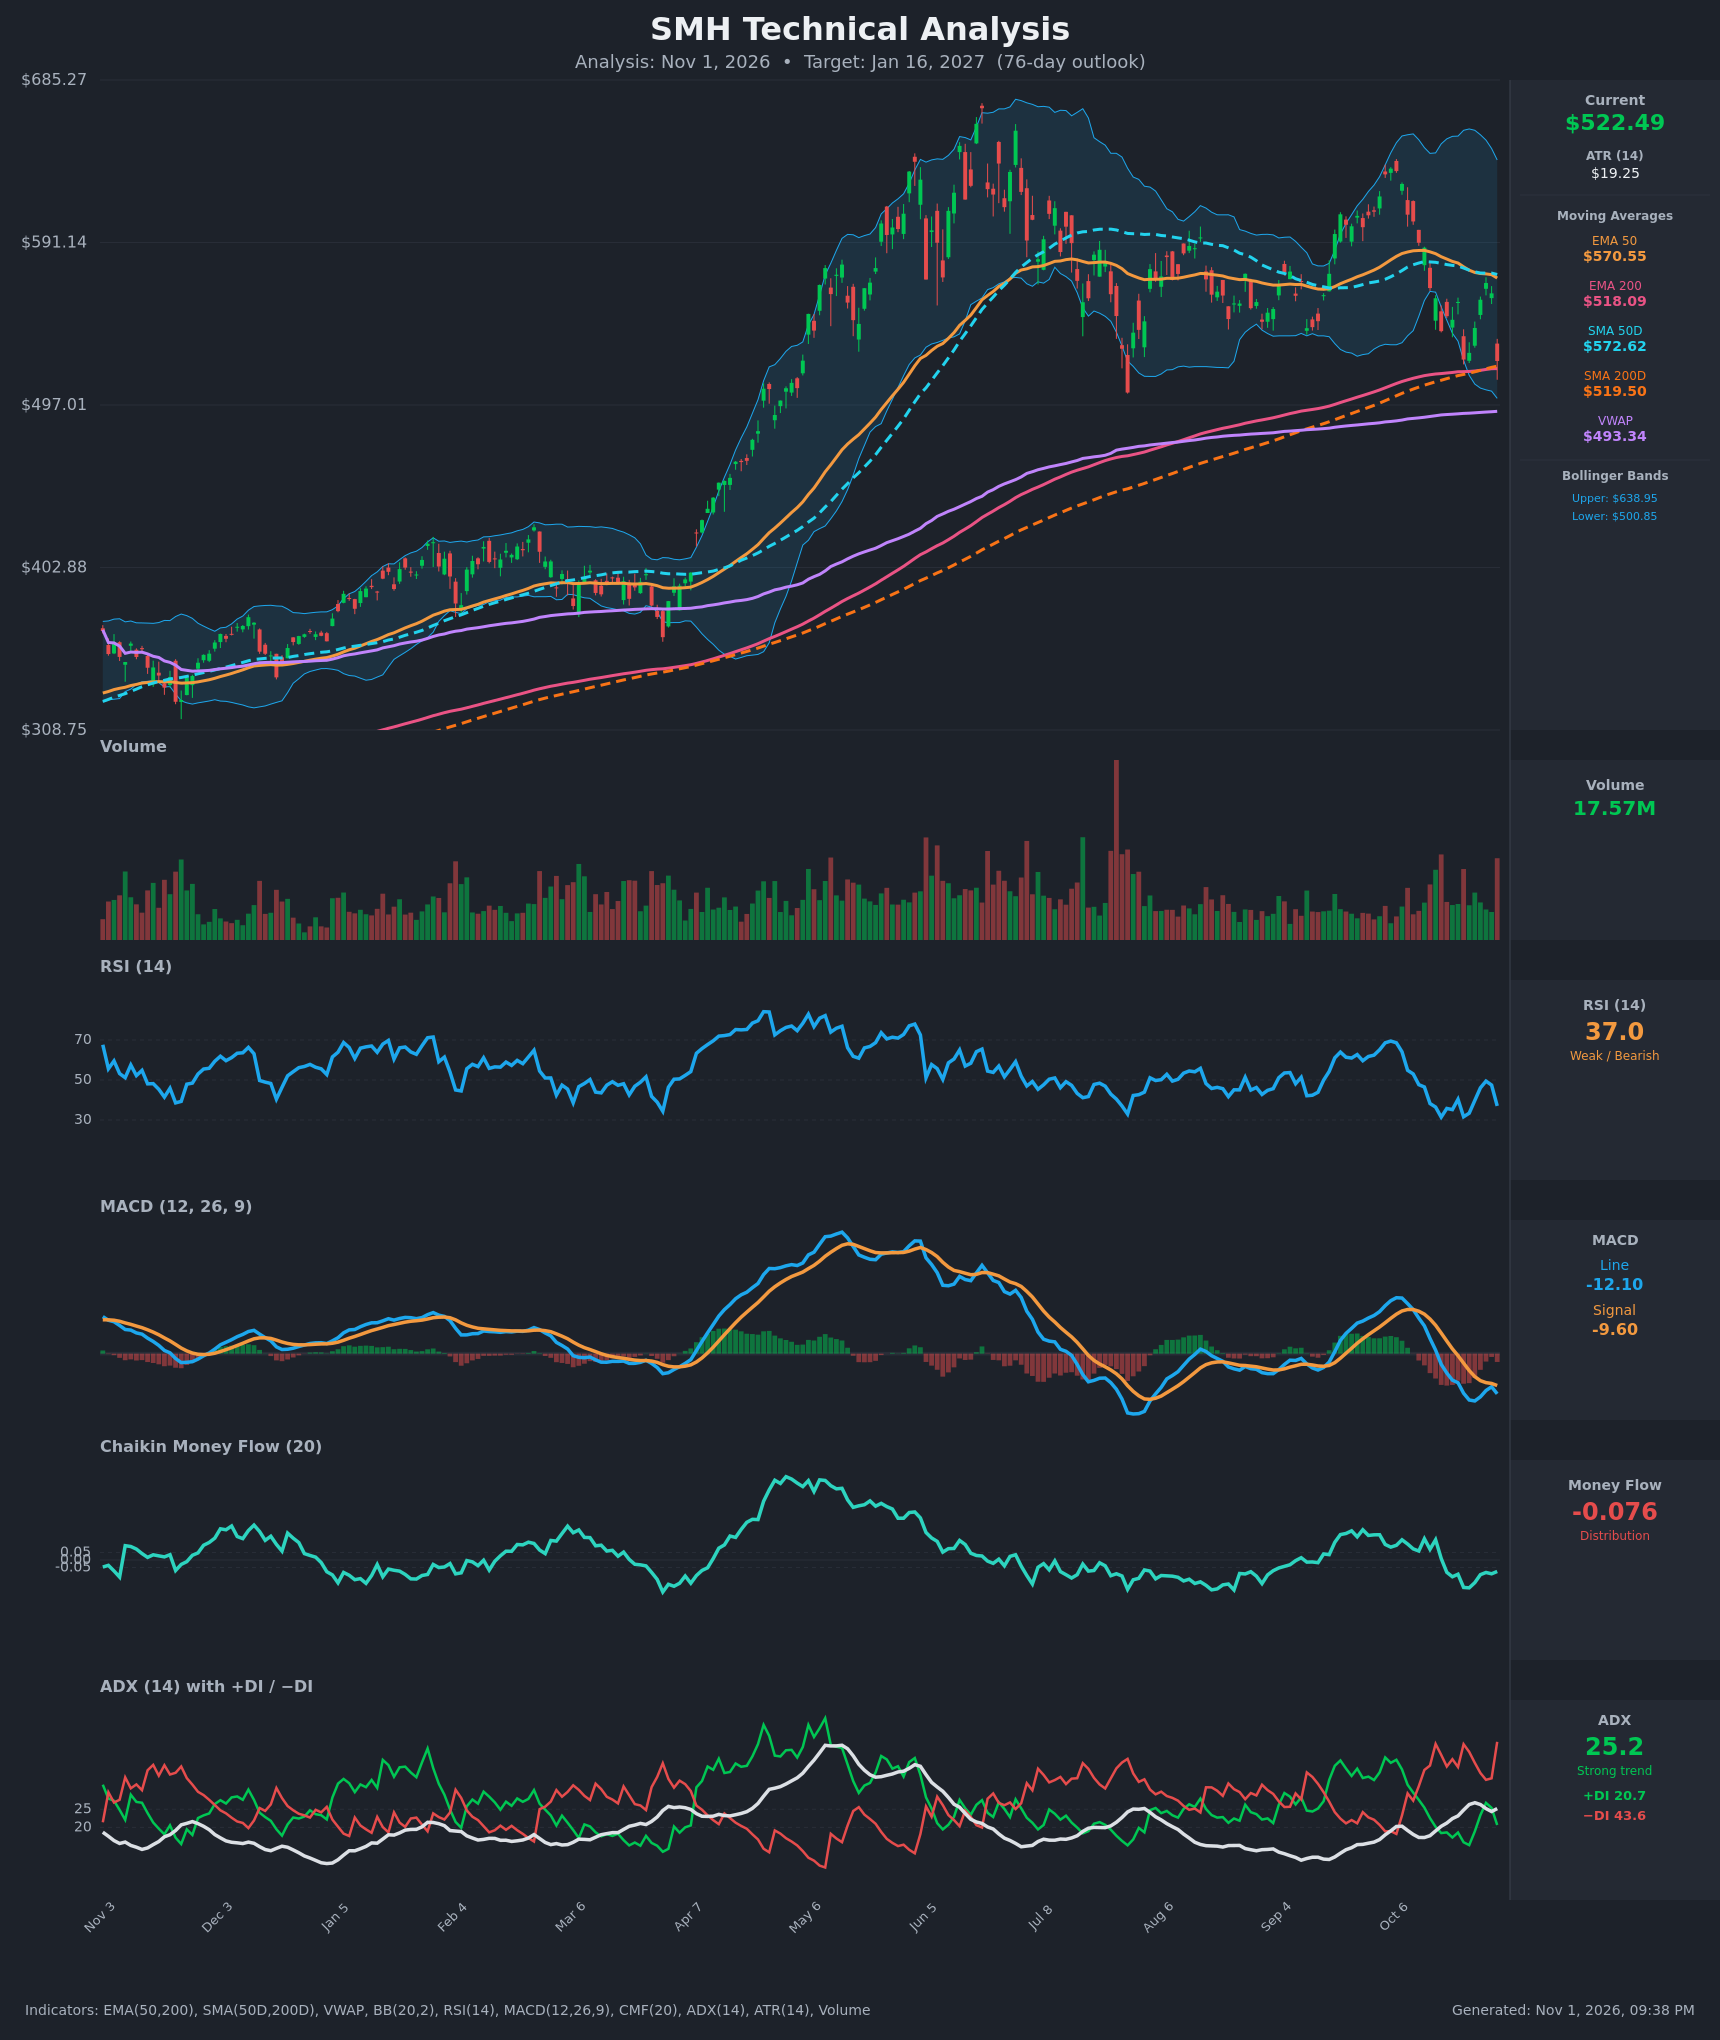
- RSI (14): 37.04, down from 49.4 on Oct 28 after a sharp drop on Oct 30. It is nearing oversold (30) but has not reached it. It made a lower high on this bounce (49 vs 69 in early Oct), so momentum is weak and falling. [Bearish]
- 20 EMA: The 20 EMA is not provided. The EMA 50 is $570.55, about 8.4% above price, so price is well below the medium-term average, which acts as overhead resistance. Rallies to ~$560-570 failed on Oct 12-13 and Oct 28. [Bearish]
- MACD: Line -12.10 is below signal -9.60, with a negative histogram of about -2.5. The line crossed below zero on Oct 16 and the signal followed on Oct 21. The line re-crossed below the signal on Oct 30 after briefly converging. [Bearish]
- Bollinger Bands (20): Upper $638.95, lower $500.85, midline about $570 (it coincides with the 50-day averages). Price is in the lower third, about $22 above the lower band, after rejection at the midline. The bands are wide, so volatility is high. A band walk toward the lower band is possible. [Bearish]
- CMF (20): -0.076, below -0.05, and negative since Oct 19. This shows persistent distribution, though not extreme. [Distribution]
- ADX (14): 25.2 with -DI 43.6 far above +DI 20.7. The trend is strong and bearish, with bears firmly in control. ADX is just above the 25 threshold and has been rising since mid-October. [Strong Trend - Bearish]
- Volume: 17.57M on the Oct 30 down bar, a high-volume red candle near the recent top of the volume range. This points to active selling and is a bearish confirmation of the breakdown from the $560s. [Bearish]
Other levels:
- Price of $522.49 sits just above the EMA 200 ($518.09) and SMA 200D ($519.50). This is the key long-term support cluster.
- Price is below the EMA 50 and SMA 50D (~$571-573). These are converging with the Bollinger midline, so the $570-573 zone is heavy resistance.
- VWAP is at $493.34, about 5.6% below price and the next support below the 200s.
- The 50/200 averages are still in a bullish stack (EMA 50 > EMA 200, SMA 50D > SMA 200D), but the gap has narrowed from ~$70 to ~$53 and is closing. A death cross is possible in the coming weeks if price breaks lower.
DIVERGENCES & TRENDS
- No bullish divergence yet. On Oct 22 RSI hit 31.6 at $523.35. The Oct 30 close at $522.49 is a nearly equal price low, but RSI is higher at 37, so there is a mild improvement that could form a double-bottom type divergence. It is not confirmed.
- Lower highs in momentum. The RSI peak fell from ~69 (early Oct) to ~49 (Oct 28), and the MACD peak fell from ~+13 to about -8.7, confirming a downtrend in momentum.
- Price structure: The June peak near $685 was followed by lower highs near $625-640 in early Oct and $590 mid-Oct, then lower lows. This is a series of lower highs, a rolling-over medium-term structure.
- DI: -DI has been above +DI since Oct 12. The gap widened to ~23 points, a strongly bearish reading.
- MA proximity: Price is testing the confluence of the 200 EMA/SMA, which has been support since April. A decisive close below confirms a long-term trend change.
- Crossovers: The MACD bearish crossover was already in force and has been re-confirmed. The 50/200 death cross has not yet occurred.
CHART PATTERNS
- Range with lower highs / Bearish Head and Shoulders (broad): The June peak (~$685) is the head. Earlier shoulders near $590-600 and the Oct ~$640 high, with neckline support near the 200-day cluster (~$518-520) and the early-Aug low (~$500), form a rough, loose H&S. A break of the neckline (~$500-518) would imply a measured move toward $380-400, which is the extreme case.
- Bearish Descending Triangle (loose): Lower highs around $590, $575 and $567 against a flat support at ~$520-525 (tested Oct 22 and Oct 30). A breakdown below ~$518 targets the triangle height (~$50-60), about $460-465.
- Double Bottom (bullish alternative): The Oct 22 and Oct 30 lows at ~$523 form a double bottom, but it is unconfirmed. It would need a close above ~$568 to activate, with a target of about $610.
- Net: the bearish structures carry more weight because of the stronger ADX/DI readings, but the 200-day cluster is a significant support, so a bounce is plausible first.
POTENTIAL SCENARIOS
- Scenario 1: Bearish Breakdown Below the 200-Day Cluster — Price loses the EMA/SMA 200 (~$518-520), the descending-triangle support breaks, and sellers push toward VWAP and the August low. A death cross becomes likely. Trigger: daily close below $515 on elevated volume. Target: $470-$490 (VWAP $493, then ~$465). Invalidation: close back above $572 (50-day cluster). (50% probability)
- Scenario 2: Neutral/Choppy Range Retest — The 200-day cluster holds as support and price chops between ~$500 and ~$570 with lower highs, in a volatile base. Trigger: failed breakdown with RSI holding above 30. Target: $500-$560. Invalidation: close below $495 or above $575. (28% probability)
- Scenario 3: Bullish Double-Bottom Rebound — The 200-day cluster holds, momentum turns, and price reclaims the 50-day average. Trigger: close above $570 with CMF back above 0. Target: $600-$625. Invalidation: close below $510. (22% probability)
PRICE TARGETS
For the 76-day timeframe (Jan 16, 2027) the range width should be ~18-30% of price. The range below is $448 to $578, width $130, or ~24.9% of $522.49, which is within the guidance.
- Target Price: $495.00 (about 5% below the current price)
- Expected Range: $448.00 to $578.00
- Key Levels: Support at $500.85 (lower Bollinger Band; VWAP $493.34 below it), Resistance at $570.55 (EMA 50 / 50-day cluster)
OVERALL BIAS
OVERALL BIAS: BEARISH - ADX is above 25 with -DI (43.6) far above +DI (20.7), MACD is below its signal and zero line, CMF shows distribution, and a high-volume drop leaves price below the 50-day averages. Support at the 200-day cluster (~$518-520) is the key level; a break would open a move toward VWAP and the mid-$400s.
This is educational analysis and not financial advice.