SPY 76-day bearish forecast — Nov 1, 2026
- Bias: Bearish
- Timeframe: 76 days (made Nov 1, 2026, target date Jan 15, 2027)
- Price at analysis: $755.72
- Price target: $740.00
- Expected range: $672.00 – $815.00
- Result: Pending — graded after the close on Jan 15, 2027
Get a free AI analysis of SPY today
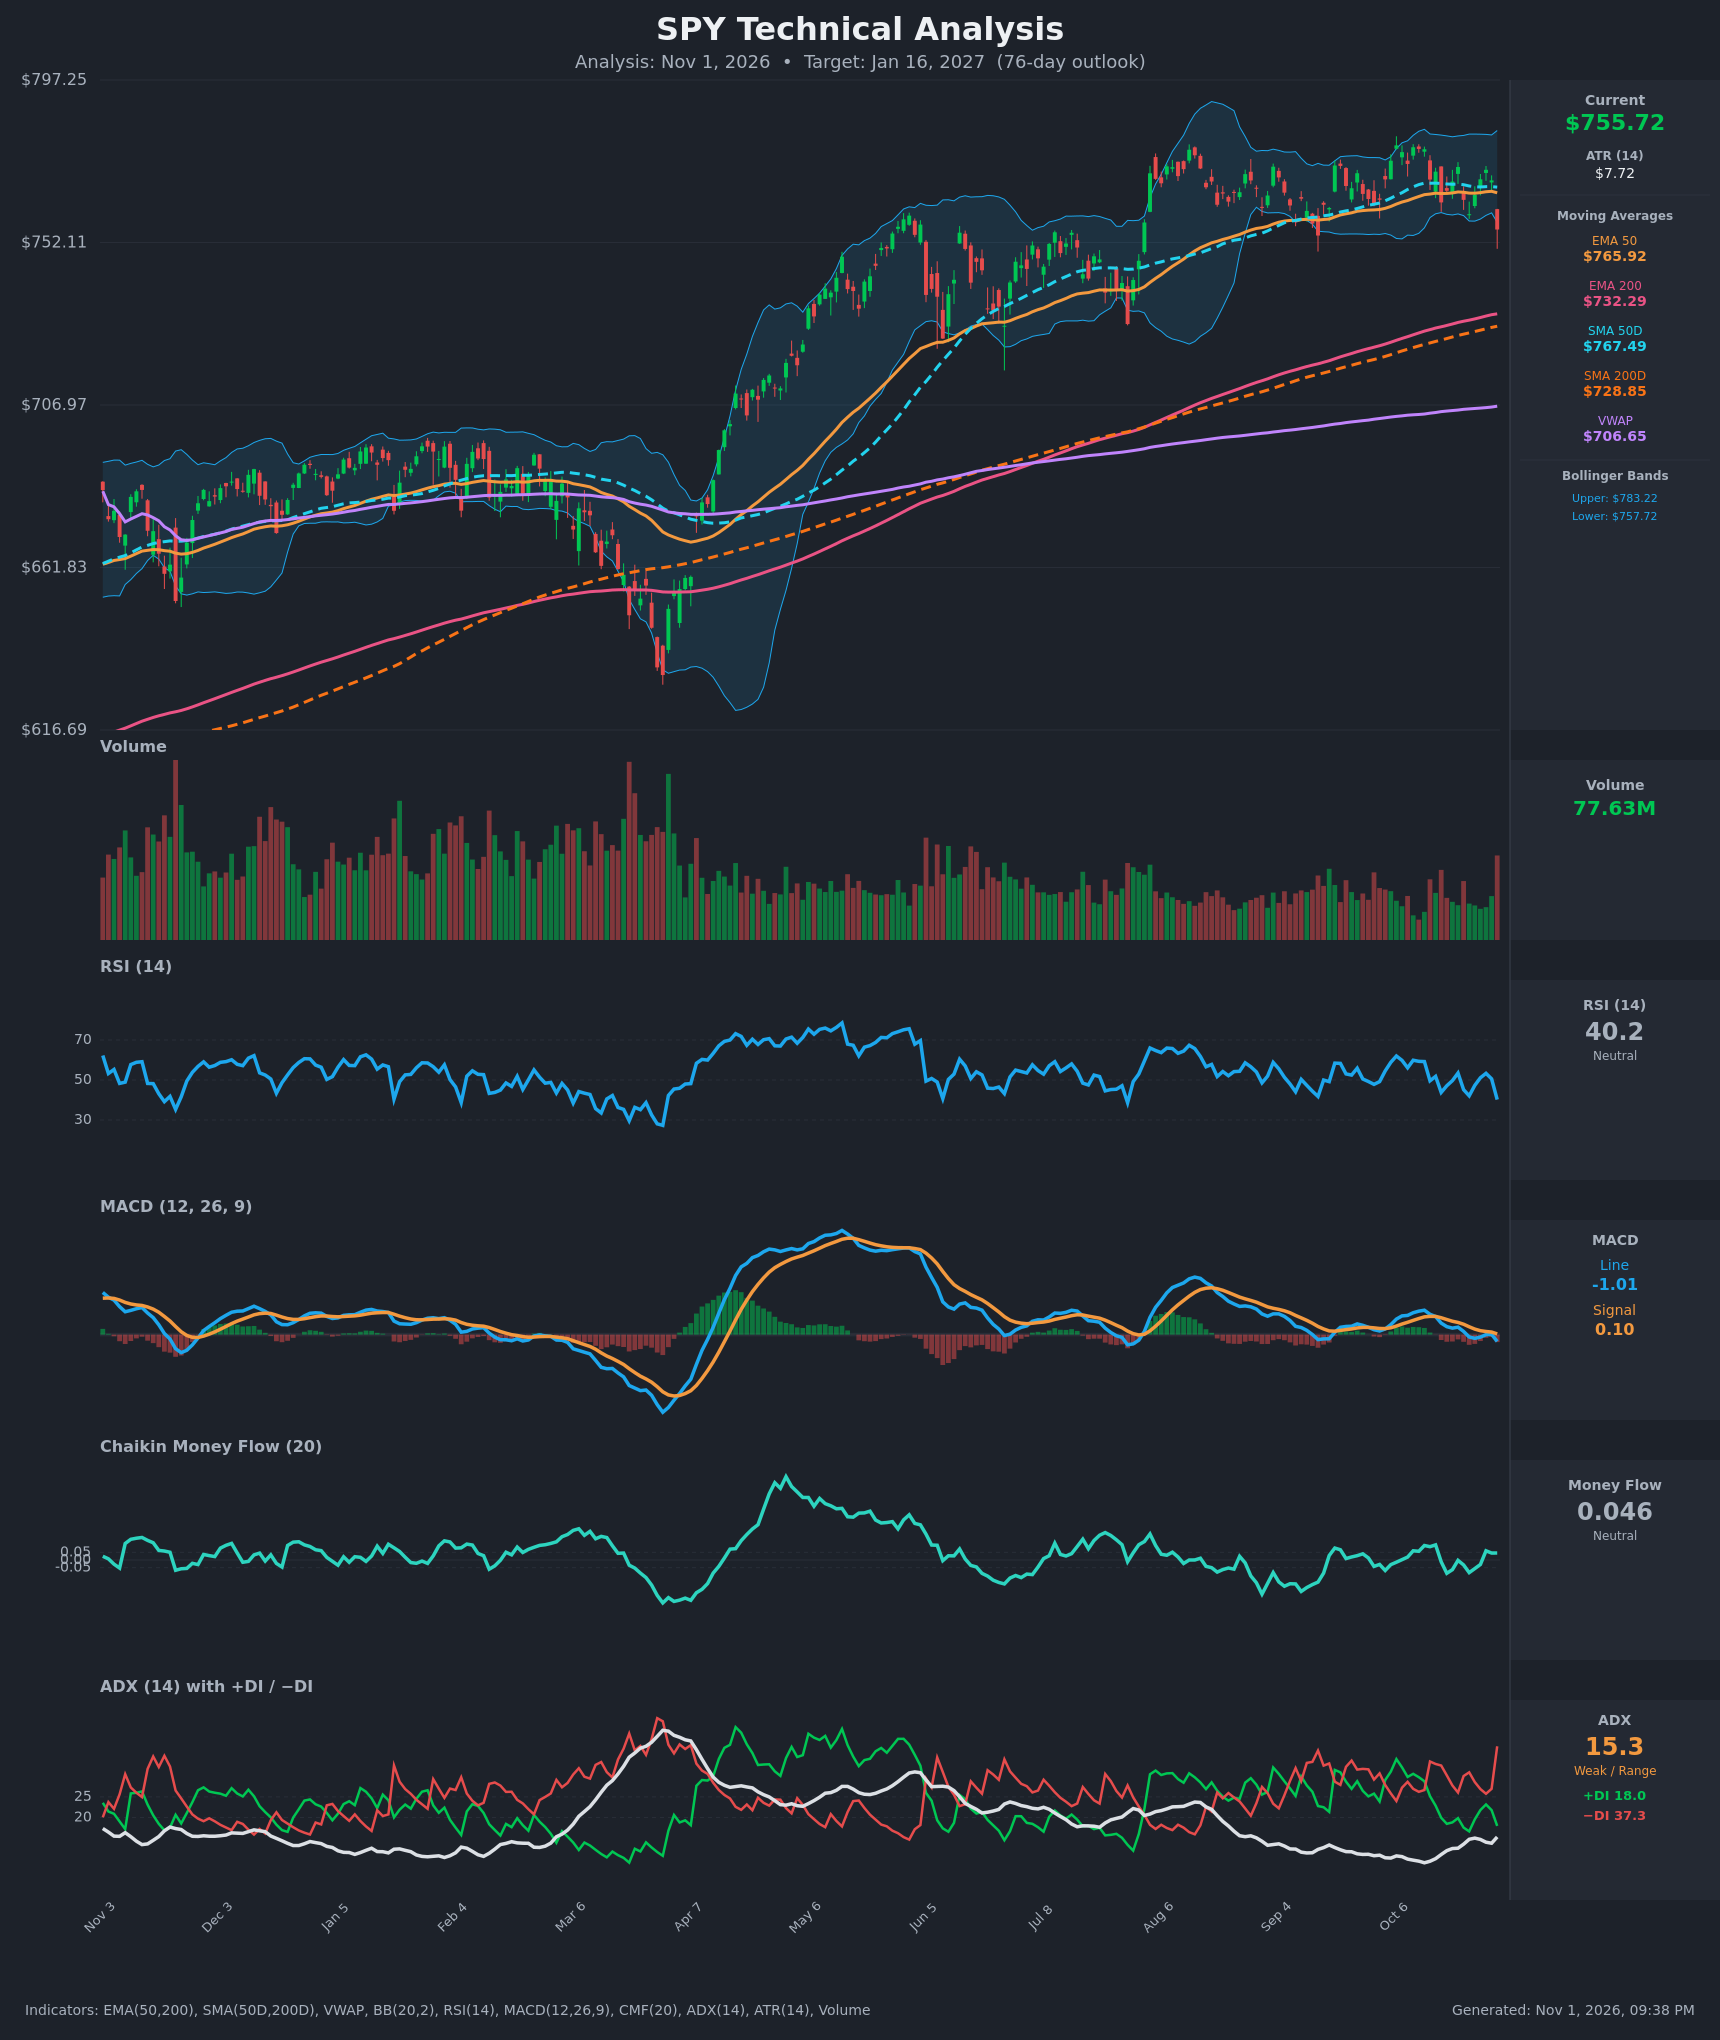
Analysis
TECHNICAL INDICATORS
- RSI (14): 40.2, down sharply from 50.6 a day earlier and the lowest since the Oct 23 dip (42.1). It is below 50 but not oversold, so there is room to fall further. Momentum is turning down. [Bearish]
- 20 EMA: The 20 EMA is not supplied, but the chart's 20-period basis (the middle Bollinger line) sits around $768-770. Price at $755.72 is below it, so it is now overhead resistance. For reference, EMA 50 is $765.92 and price is also below it, while EMA 200 ($732.29) is about 3% below. [Bearish]
- MACD: The line (-1.01) crossed below the signal (+0.10) on the last bar, a fresh bearish crossover. The histogram has turned negative and the line is just under zero. The MACD has been flat and choppy since August, so this is a modest, not powerful, signal. [Bearish]
- Bollinger Bands (20): Price at $755.72 closed just below the lower band ($757.72). The bands are fairly narrow ($757.72 to $783.22, about 3.4% wide). A close outside the lower band after a long range is a breakdown attempt, though it can also mean a short-term oversold snap-back toward the mid-band. [Bearish]
- CMF (20): 0.046 sits just inside the neutral zone (±0.05). It has drifted down from about 0.10 on Oct 13-15 and was negative for most of Oct 16-27. Buying pressure is not convincing. [Neutral]
- ADX (14): 15.3 is weak/range-bound but ticking up. −DI (37.3) is well above +DI (18.0), and the gap has widened sharply in the last session. Bears have the short-term edge, but with ADX below 20 this is not yet a confirmed trend. [Weak Trend, bearish lean]
- Volume: 77.63M is the heaviest bar in months, on a red candle that broke below the range. The volume spike on a down day suggests distribution or a capitulation-type probe, which gives the break more credibility. [Bearish]
DIVERGENCES & TRENDS
- Long-term structure: Price is above SMA200D ($728.85) and EMA200 ($732.29), and the EMA50/SMA50D are above the 200s. The golden cross is long established and no death cross is near, so the primary trend is up.
- Short-term structure: Price has been range-bound since early August at roughly $755-$785 with weakening upside. It is now below the EMA50 ($765.92), SMA50D ($767.49) and the lower Bollinger Band.
- MACD: The bearish crossover on Oct 30 follows a gradual slide from +3.6 on Oct 13. Momentum has been fading for over two weeks.
- RSI: It made lower highs (59 → 53 → 53 → 40) while price held near the range top, a mild bearish momentum drift.
- DI: −DI crossed above +DI on Oct 14 and the spread widened to about 19 points. ADX is rising from the low base, which hints at a trend beginning.
- VWAP ($706.65): Price is well above it, so longer-term buyers still hold large profits. This is a distant support, not a near-term one.
- Price vs. moving averages: The 200-day cluster ($729-$732) is the next major magnet, about 3-3.5% below.
CHART PATTERNS
- Bearish Triple/Double Top (reversal, range variant): Price has repeatedly stalled at about $783-$790 since August, and the lower rectangle boundary near $757 has just failed. The pattern height is about $30 ($755-$785), so the measured move is about $725, right at the SMA200D/EMA200 cluster.
- Rectangle/range breakdown (continuation vs. reversal): The long-term trend is up, so the break could instead be a shakeout. The 200-day band is the key line between a healthy pullback and a trend change.
- Bullish Flag/Ascending Triangle: These would only be valid if price quickly reclaims $767-$770. Currently they are not confirmed.
POTENTIAL SCENARIOS
- Scenario 1: Bearish Pullback to the 200-Day Zone — The range breakdown extends, with −DI dominance and the MACD cross driving a retest of the long-term averages. Trigger: sustained closes below $755 and then below $745 on firm volume. Target: $730-$740, with the measured move near $725. Invalidation: a daily close back above $768 (SMA50D/EMA50). (45% probability)
- Scenario 2: Bullish Range Recovery — The Bollinger break proves a false breakdown, price snaps back above the 50-day averages, and the range top is retested. Trigger: a reclaim of $768 with CMF above +0.05 and MACD re-crossing the signal. Target: $783-$800. Invalidation: a close below $745. (35% probability)
- Scenario 3: Bearish Deeper Correction — The 200-day support fails after the retest and a broader risk-off move develops. Trigger: a weekly close below $728 on rising volume. Target: $690-$700, near VWAP at $706 and below. Invalidation: a rebound above $750 after the 200-day test. (20% probability)
PRICE TARGETS
- Target Price: $740.00 (76-day horizon)
- Expected Range: $672.00 to $815.00. Width is $143, about 18.9% of the current price, which fits the 61-180 day guidance of 18-30%.
- Key Levels: Support at $732.29 (EMA200, with SMA200D at $728.85 just below), Resistance at $767.49 (SMA50D, with EMA50 at $765.92)
OVERALL BIAS
OVERALL BIAS: BEARISH - A heavy-volume close below the range and the lower Bollinger Band, a fresh bearish MACD crossover, −DI far above +DI and RSI rolling over point to a pullback toward the 200-day averages (about $732-$740). The primary uptrend and the 200-day support keep conviction modest.
This is educational analysis and not financial advice.