SOXL 76-day bearish forecast — Nov 1, 2026
- Bias: Bearish
- Timeframe: 76 days (made Nov 1, 2026, target date Jan 15, 2027)
- Price at analysis: $77.05
- Price target: $69.00
- Expected range: $59.00 – $82.00
- Result: Pending — graded after the close on Jan 15, 2027
Get a free AI analysis of SOXL today
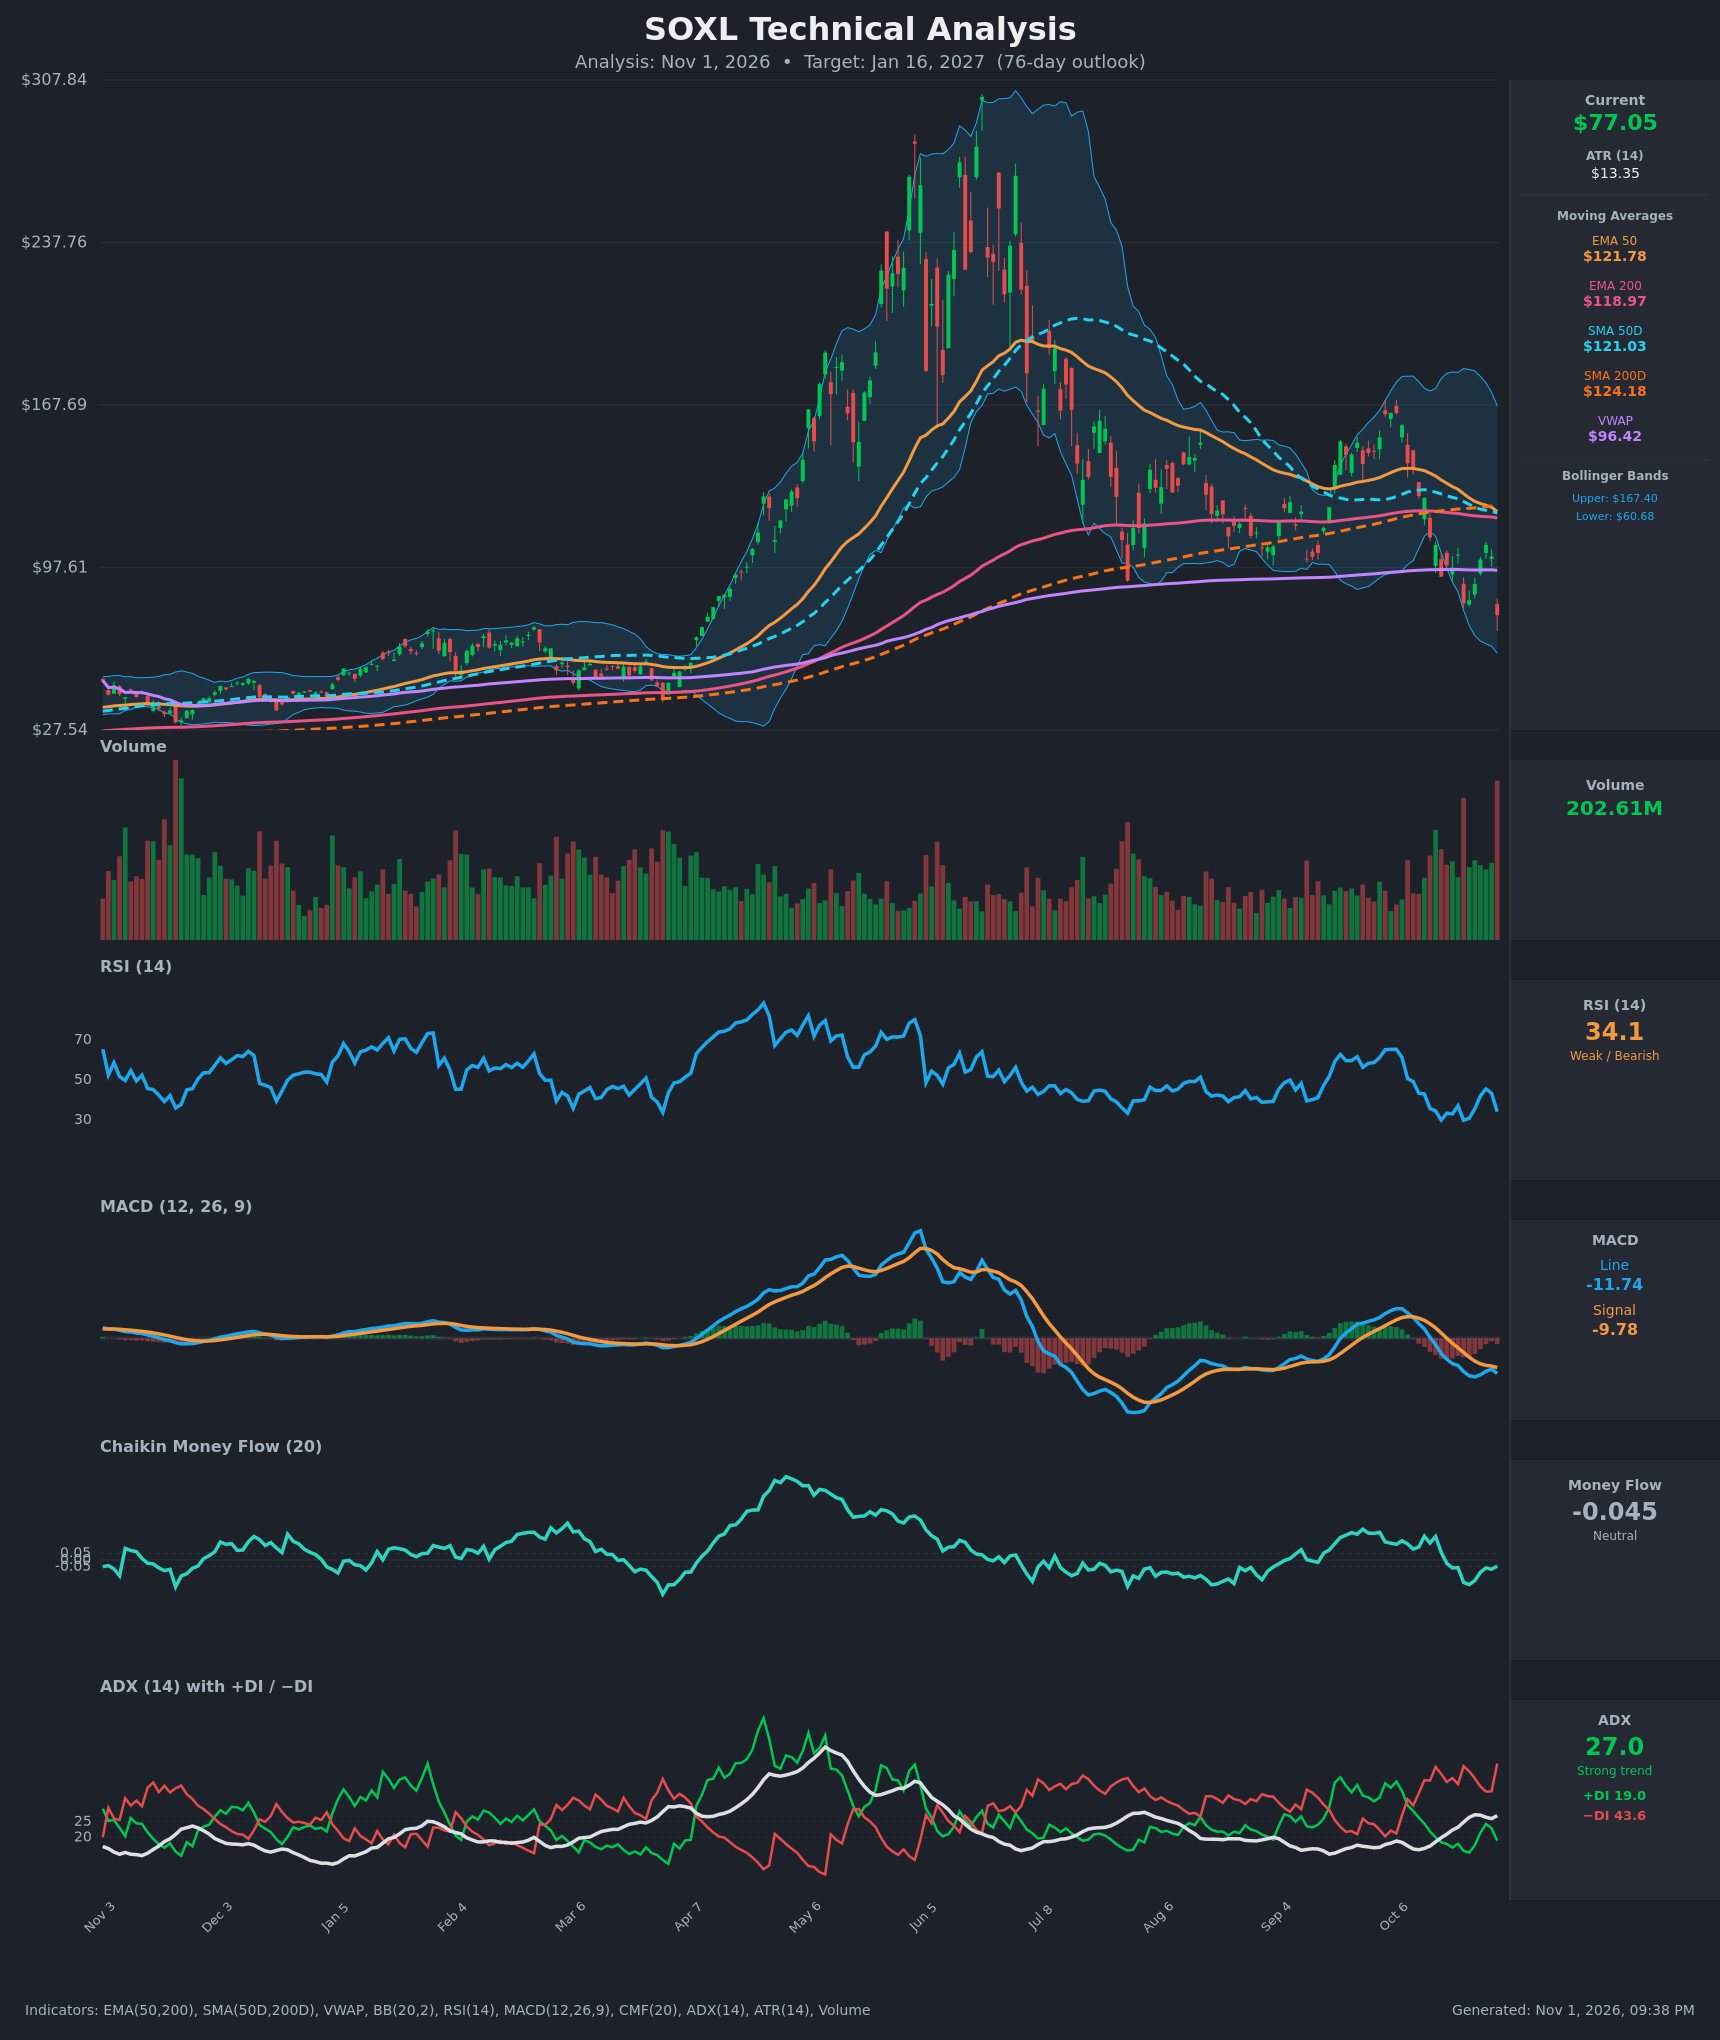
Analysis
TECHNICAL INDICATORS
- RSI (14): 34.14, down from 45.6 on Oct 28 and just above the 30 oversold line. It was already hitting ~30 on Oct 16 and Oct 22, and the bounces from those lows were weak. Momentum is bearish but close to stretched. [Bearish]
- 20 EMA: The 20 EMA isn't supplied. Price of $77.05 sits far below the EMA50 ($121.78) and EMA200 ($118.97), and the short-term averages are rolling over. Price is well under every moving average, so overhead averages act as resistance. [Bearish]
- MACD: Line -11.74 is below signal -9.78, so the histogram is negative at about -1.95. The bearish crossover happened on Oct 19. The line is turning lower again after a brief flattening, so downside momentum is re-accelerating. [Bearish]
- Bollinger Bands (20): Upper $167.40, lower $60.68, midline ~$114. Price is in the lower third, about 15% above the lower band. The bands are wide and starting to contract, which reflects the earlier volatility. A walk toward the lower band is plausible. [Bearish]
- CMF (20): -0.045, slipping from +0.17 on Oct 15 to mildly negative. It is inside the neutral band, but the trend is clearly toward distribution. [Neutral]
- ADX (14): 27.0 and rising, from 16 on Oct 12. −DI at 43.6 is far above +DI at 19.0, so sellers control a strengthening downtrend. [Strong Trend – Bearish]
- Volume: 202.61M, the highest bar on the chart, on a ~25% one-day drop (Oct 29 $102.39 → Oct 30 $77.05). Heavy volume on a red candle is distribution or capitulation, and no reversal is confirmed yet. [Bearish with possible capitulation]
DIVERGENCES & TRENDS
- No bullish divergence yet. RSI made equal lows near 30 on Oct 16 and Oct 22, and price made a lower low on Oct 30. RSI is now 34, so momentum is confirming price.
- Death cross: SMA50D crossed below SMA200D around Oct 28 (SMA50D $121.03 vs SMA200D $124.18). EMA50 ($121.78) is only about $2.80 above EMA200 ($118.97) and converging fast, so an EMA death cross is imminent.
- MACD crossed bearish on Oct 19 and has stayed below zero and below its signal since, making new lows.
- DI and ADX: −DI has been above +DI throughout. ADX has crossed above 25 and is rising, so the trend is strengthening.
- Long-term trend: Price is far below SMA200D and VWAP ($96.42), which confirms a long-term downtrend after the ~$300 peak.
- Trend structure: Lower highs ($300 → ~$167 → ~$128) and lower lows. Price lost the prior swing low of about $82 on Oct 22.
CHART PATTERNS
- Bearish Head and Shoulders (closest match, macro scale): The June peak near $300 is the head. The September rally to about $165 is a lower right shoulder. The neckline sits around the $82–97 zone, roughly the Oct lows and the VWAP. Price is now at or below that neckline. The measured move is mathematically huge (~$200), so it is unrealistic to take literally. It does suggest a retest of the March–April base in the $50–60 area.
- Bearish continuation overlay: The Sep–Oct decline after the failed rally resembles a Bearish Flag/Descending structure, with lower highs and a breakdown on expanding volume.
- Caveat: The 25% one-day flush on record volume near the lower Bollinger Band is the kind of climax that often produces violent relief rallies in 3x leveraged ETFs.
POTENTIAL SCENARIOS
- Scenario 1: Bearish Trend Continuation — The death cross, strong −DI dominance and a rising ADX keep sellers in control. Price grinds lower, with rallies sold at the falling EMAs, and tests the lower Bollinger Band. Trigger: daily close below $72 and failure to reclaim $90. Target: $60–69, with an extension to the $50 base. Invalidation: daily close above $97 (VWAP). (50% probability)
- Scenario 2: Bullish Capitulation Bounce — The record-volume flush and RSI near 30 spark a sharp mean-reversion rally, as is typical for SOXL. Price fills the gap toward the $90–$105 zone but stalls under the falling averages. Trigger: RSI bullish divergence and a close above $90.50. Target: $95–$105. Invalidation: close below $60. (35% probability)
- Scenario 3: Neutral Base-Building Range — Price chops between $60 and $90 as volatility compresses. Trigger: ADX falling below 20 and CMF hovering around zero. Target: $70–$80. Invalidation: close outside the $60–$90 range. (15% probability)
PRICE TARGETS
Range check: $82.00 − $59.00 = $23.00, which is about 29.9% of $77.05. That fits the 61–180 day band (18–30%) and is far wider than any 2–14 day range.
- Target Price: $69.00 (76-day, slightly below current price on trend persistence)
- Expected Range: $59.00 to $82.00
- Key Levels: Support at $60.68 (lower Bollinger Band), Resistance at $96.42 (VWAP; interim resistance near $90.50)
OVERALL BIAS
OVERALL BIAS: BEARISH - Price is below all key moving averages after a death cross, MACD is bearish, and ADX is rising with −DI (43.6) dominating +DI (19.0). A relief bounce is possible after the capitulation-style volume spike, but the weight of evidence favors lower prices over 76 days.
This is educational analysis and not financial advice.